

现代地质 ›› 2022, Vol. 36 ›› Issue (02): 389-405.DOI: 10.19657/j.geoscience.1000-8527.2022.002
刘茂涵1,2( ), 刘海燕1,2(), 张卫民1,2, 王振1,2, 吴通航1,2, 王玉罡2
收稿日期:2021-09-30
修回日期:2022-03-10
出版日期:2022-04-10
发布日期:2022-06-01
通讯作者:
刘海燕
作者简介:刘海燕,男,讲师,1988年出生,水文地质专业,从事水文地球化学方面研究。Email: hy_liu@ecut.edu.cn。基金资助:
LIU Maohan1,2(), LIU Haiyan1,2(), ZHANG Weimin1,2, WANG Zhen1,2, WU Tonghang1,2, WANG Yugang2
Received:2021-09-30
Revised:2022-03-10
Online:2022-04-10
Published:2022-06-01
Contact:
LIU Haiyan
摘要:
稀土的开发和广泛应用使得人们倍加关注其在环境中的分布及其环境地球化学行为。赣江作为鄱阳湖流域五大入湖河之一,发源于稀土资源富集的赣南地区,而其下游水体及周边地下水中稀土元素的含量和分异特征目前尚不完全清楚。以赣江北支水体及沉积物为研究对象,开展了稀土元素地球化学研究。结果表明,赣江北支水体中稀土元素总量在地表水中为230~1 146 ng/L(均值458.85 ng/L),地下水中为284~1 498 ng/L(均值634.94 ng/L),沉积物中稀土元素总量为177.9~270.7 mg/kg(均值226.99 mg/kg)。PHREEQC模拟计算表明,水体中的稀土元素主要以碳酸根络合物(REEC03+)的形式存在。地表水和地下水总体上均表现为重稀土元素相较于轻、中稀土元素富集,沉积物未表现出明显的富集特性;水体具有Ce、Eu负异常特点,而沉积物表现为Ce正异常和Eu负异常,指示氧化还原环境和水岩相互作用对稀土元素在水-沉积物系统中迁移转化的影响。地下水中稀土元素的含量沿流向具有上升趋势,而水体中重稀土元素的富集程度不断减弱,同时碳酸根络合物(REEC03+)的占比不断降低,反映水体中稀土元素的含量受到pH、胶体吸附、络合作用以及地下水-地表水相互作用的影响。水体中重稀土元素的富集受到碳酸根络合反应的影响,Ce、Eu负异常与Ce氧化沉淀和母岩特性相关。Gd异常值表明,研究区中下游水体中的Gd元素受到人为输入的影响。
中图分类号:
刘茂涵, 刘海燕, 张卫民, 王振, 吴通航, 王玉罡. 鄱阳湖流域赣江北支水体和沉积物中稀土元素的含量和分异特征[J]. 现代地质, 2022, 36(02): 389-405.
LIU Maohan, LIU Haiyan, ZHANG Weimin, WANG Zhen, WU Tonghang, WANG Yugang. REE Concentration and Fractionation in Waters and Sediments from the Northern Branch of Ganjiang River, Poyang Lake Catchment[J]. Geoscience, 2022, 36(02): 389-405.
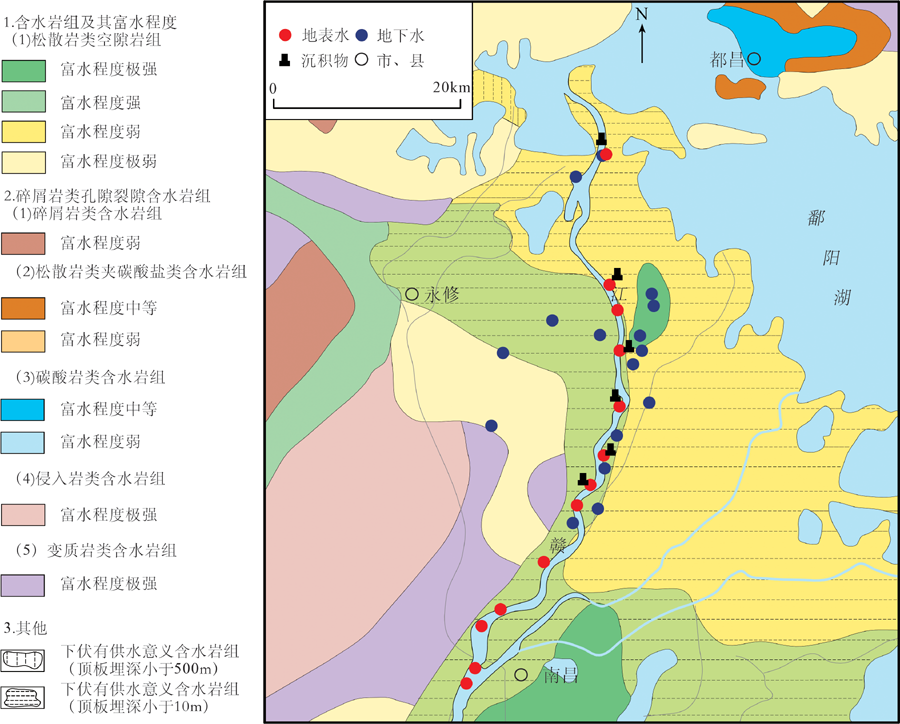
图1 研究区水文地质图及采样点分布
Fig.1 Hydrogeological map of the study area and sampling sites distribution
| 反应方程 | 平衡常数 | 参考文献 | |||||||||||||
|---|---|---|---|---|---|---|---|---|---|---|---|---|---|---|---|
| La | Ce | Pr | Nd | Sm | Eu | Gd | Tb | Dy | Ho | Er | Tm | Yb | Lu | ||
| REE3+ + H2O= REEOH2+ + H+ | -8.81 | -8.34 | -8.32 | -8.18 | -7.84 | -7.76 | -7.83 | -7.64 | -7.59 | -7.56 | -7.52 | -7.39 | -7.24 | -7.27 | [ |
| REE3+ + 2H2O= REE(OH | -18.14 | -17.60 | -17.27 | -17.04 | -16.51 | -16.37 | -16.37 | -16.18 | -16.10 | -16.07 | -15.96 | -15.88 | -15.74 | -16.67 | [ |
| REE3+ + 3H2O= REE(OH)3 + 3H+ | -27.90 | -27.23 | -26.63 | -26.40 | -25.91 | -25.41 | -2.28 | -25.08 | -24.83 | -24.56 | -24.35 | -24.18 | -23.85 | -23.85 | [ |
| REE3+ + C REEC | 7.12 | 7.40 | 7.57 | 7.69 | 7.81 | 8.00 | 7.97 | 8.08 | 8.14 | 8.18 | 8.24 | 8.32 | 8.40 | 8.43 | [ |
| REE3+ + 2C REE(CO3 | 11.30 | 11.76 | 12.08 | 12.17 | 12.53 | 12.63 | 12.48 | 12.78 | 12.91 | 13.00 | 13.12 | 13.27 | 13.30 | 13.37 | [ |
| REE3+ + S REES | 3.62 | 3.59 | 3.62 | 3.64 | 3.66 | 3.66 | 3.66 | 3.64 | 3.61 | 3.59 | 3.59 | 3.59 | 3.59 | 3.59 | [ |
| REE3+ + F-= REEF2+ | 3.12 | 3.28 | 3.48 | 3.56 | 3.58 | 3.63 | 3.75 | 3.85 | 3.89 | 3.95 | 3.98 | 3.99 | 4.02 | 4.05 | [ |
| REE3+ + Cl-= REECl2+ | 0.74 | 0.68 | 0.71 | 0.71 | 0.67 | 0.69 | 0.71 | 0.67 | 0.70 | 0.71 | 0.70 | 0.71 | 0.69 | 0.67 | [ |
| REE3+ + 2Cl-= REEC | 0.51 | 0.46 | 0.45 | 0.47 | 0.42 | 0.44 | 0.46 | 0.43 | 0.43 | 0.45 | 0.45 | 0.46 | 0.44 | 0.43 | [ |
| REE3+ + N REE(NO3)2+ | 0.58 | 0.69 | 0.69 | 0.79 | 0.78 | 0.83 | 0.47 | 0.51 | 0.15 | 0.25 | 0.15 | 0.20 | 0.25 | 0.56 | [ |
表1 加入WATEQ4F数据库的反应(离子强度IS=0,温度25 ℃,REE代表稀土元素)
Table 1 Reactions added to the WATEQ4F database (IS=0, T=25 ℃, REE denoting rare earth elements)
| 反应方程 | 平衡常数 | 参考文献 | |||||||||||||
|---|---|---|---|---|---|---|---|---|---|---|---|---|---|---|---|
| La | Ce | Pr | Nd | Sm | Eu | Gd | Tb | Dy | Ho | Er | Tm | Yb | Lu | ||
| REE3+ + H2O= REEOH2+ + H+ | -8.81 | -8.34 | -8.32 | -8.18 | -7.84 | -7.76 | -7.83 | -7.64 | -7.59 | -7.56 | -7.52 | -7.39 | -7.24 | -7.27 | [ |
| REE3+ + 2H2O= REE(OH | -18.14 | -17.60 | -17.27 | -17.04 | -16.51 | -16.37 | -16.37 | -16.18 | -16.10 | -16.07 | -15.96 | -15.88 | -15.74 | -16.67 | [ |
| REE3+ + 3H2O= REE(OH)3 + 3H+ | -27.90 | -27.23 | -26.63 | -26.40 | -25.91 | -25.41 | -2.28 | -25.08 | -24.83 | -24.56 | -24.35 | -24.18 | -23.85 | -23.85 | [ |
| REE3+ + C REEC | 7.12 | 7.40 | 7.57 | 7.69 | 7.81 | 8.00 | 7.97 | 8.08 | 8.14 | 8.18 | 8.24 | 8.32 | 8.40 | 8.43 | [ |
| REE3+ + 2C REE(CO3 | 11.30 | 11.76 | 12.08 | 12.17 | 12.53 | 12.63 | 12.48 | 12.78 | 12.91 | 13.00 | 13.12 | 13.27 | 13.30 | 13.37 | [ |
| REE3+ + S REES | 3.62 | 3.59 | 3.62 | 3.64 | 3.66 | 3.66 | 3.66 | 3.64 | 3.61 | 3.59 | 3.59 | 3.59 | 3.59 | 3.59 | [ |
| REE3+ + F-= REEF2+ | 3.12 | 3.28 | 3.48 | 3.56 | 3.58 | 3.63 | 3.75 | 3.85 | 3.89 | 3.95 | 3.98 | 3.99 | 4.02 | 4.05 | [ |
| REE3+ + Cl-= REECl2+ | 0.74 | 0.68 | 0.71 | 0.71 | 0.67 | 0.69 | 0.71 | 0.67 | 0.70 | 0.71 | 0.70 | 0.71 | 0.69 | 0.67 | [ |
| REE3+ + 2Cl-= REEC | 0.51 | 0.46 | 0.45 | 0.47 | 0.42 | 0.44 | 0.46 | 0.43 | 0.43 | 0.45 | 0.45 | 0.46 | 0.44 | 0.43 | [ |
| REE3+ + N REE(NO3)2+ | 0.58 | 0.69 | 0.69 | 0.79 | 0.78 | 0.83 | 0.47 | 0.51 | 0.15 | 0.25 | 0.15 | 0.20 | 0.25 | 0.56 | [ |
| 区域 | 统计量 | pH | TDS | Cl- | S | N | HC | Ca2+ | K+ | Mg2+ | Na+ |
|---|---|---|---|---|---|---|---|---|---|---|---|
| 上游 | 最大值 | 7.39 | 113.00 | 21.10 | 16.94 | 4.64 | 67.96 | 18.61 | 10.09 | 3.22 | 11.63 |
| 最小值 | 6.94 | 87.95 | 15.75 | 7.31 | 1.14 | 54.37 | 17.51 | 3.51 | 3.08 | 9.50 | |
| 平均值 | 7.23 | 95.98 | 18.28 | 11.33 | 2.07 | 62.53 | 17.84 | 6.93 | 3.12 | 10.16 | |
| 标准差 | 0.18 | 9.77 | 2.23 | 4.24 | 1.50 | 7.44 | 0.45 | 2.76 | 0.06 | 0.86 | |
| 变异系数 | 0.02 | 0.10 | 0.12 | 0.37 | 0.73 | 0.12 | 0.03 | 0.40 | 0.02 | 0.08 | |
| 中游 | 最大值 | 7.81 | 92.15 | 21.48 | 18.28 | 5.79 | 67.96 | 19.47 | 5.16 | 3.51 | 11.07 |
| 最小值 | 7.34 | 88.45 | 11.19 | 6.94 | 1.17 | 40.78 | 17.65 | 3.26 | 3.12 | 10.09 | |
| 平均值 | 7.50 | 90.24 | 17.38 | 14.87 | 3.87 | 54.37 | 18.50 | 3.86 | 3.29 | 10.64 | |
| 标准差 | 0.21 | 1.73 | 4.63 | 5.35 | 1.96 | 11.10 | 0.78 | 0.89 | 0.19 | 0.50 | |
| 变异系数 | 0.03 | 0.02 | 0.27 | 0.36 | 0.51 | 0.20 | 0.04 | 0.23 | 0.06 | 0.05 | |
| 下游 | 最大值 | 7.33 | 89.00 | 18.41 | 16.46 | 4.49 | 67.96 | 17.70 | 5.59 | 3.15 | 11.25 |
| 最小值 | 7.19 | 86.95 | 12.93 | 7.15 | 1.17 | 54.37 | 16.95 | 3.25 | 3.09 | 10.13 | |
| 平均值 | 7.26 | 88.00 | 16.48 | 13.14 | 3.26 | 57.77 | 17.28 | 4.49 | 3.13 | 10.60 | |
| 标准差 | 0.06 | 0.84 | 2.47 | 4.38 | 1.52 | 6.80 | 0.31 | 1.22 | 0.02 | 0.48 | |
| 变异系数 | 0.01 | 0.01 | 0.15 | 0.33 | 0.47 | 0.12 | 0.02 | 0.27 | 0.01 | 0.05 |
表2 研究区地表水水化学组分
Table 2 Chemical compositions of surface water samples from the study area
| 区域 | 统计量 | pH | TDS | Cl- | S | N | HC | Ca2+ | K+ | Mg2+ | Na+ |
|---|---|---|---|---|---|---|---|---|---|---|---|
| 上游 | 最大值 | 7.39 | 113.00 | 21.10 | 16.94 | 4.64 | 67.96 | 18.61 | 10.09 | 3.22 | 11.63 |
| 最小值 | 6.94 | 87.95 | 15.75 | 7.31 | 1.14 | 54.37 | 17.51 | 3.51 | 3.08 | 9.50 | |
| 平均值 | 7.23 | 95.98 | 18.28 | 11.33 | 2.07 | 62.53 | 17.84 | 6.93 | 3.12 | 10.16 | |
| 标准差 | 0.18 | 9.77 | 2.23 | 4.24 | 1.50 | 7.44 | 0.45 | 2.76 | 0.06 | 0.86 | |
| 变异系数 | 0.02 | 0.10 | 0.12 | 0.37 | 0.73 | 0.12 | 0.03 | 0.40 | 0.02 | 0.08 | |
| 中游 | 最大值 | 7.81 | 92.15 | 21.48 | 18.28 | 5.79 | 67.96 | 19.47 | 5.16 | 3.51 | 11.07 |
| 最小值 | 7.34 | 88.45 | 11.19 | 6.94 | 1.17 | 40.78 | 17.65 | 3.26 | 3.12 | 10.09 | |
| 平均值 | 7.50 | 90.24 | 17.38 | 14.87 | 3.87 | 54.37 | 18.50 | 3.86 | 3.29 | 10.64 | |
| 标准差 | 0.21 | 1.73 | 4.63 | 5.35 | 1.96 | 11.10 | 0.78 | 0.89 | 0.19 | 0.50 | |
| 变异系数 | 0.03 | 0.02 | 0.27 | 0.36 | 0.51 | 0.20 | 0.04 | 0.23 | 0.06 | 0.05 | |
| 下游 | 最大值 | 7.33 | 89.00 | 18.41 | 16.46 | 4.49 | 67.96 | 17.70 | 5.59 | 3.15 | 11.25 |
| 最小值 | 7.19 | 86.95 | 12.93 | 7.15 | 1.17 | 54.37 | 16.95 | 3.25 | 3.09 | 10.13 | |
| 平均值 | 7.26 | 88.00 | 16.48 | 13.14 | 3.26 | 57.77 | 17.28 | 4.49 | 3.13 | 10.60 | |
| 标准差 | 0.06 | 0.84 | 2.47 | 4.38 | 1.52 | 6.80 | 0.31 | 1.22 | 0.02 | 0.48 | |
| 变异系数 | 0.01 | 0.01 | 0.15 | 0.33 | 0.47 | 0.12 | 0.02 | 0.27 | 0.01 | 0.05 |
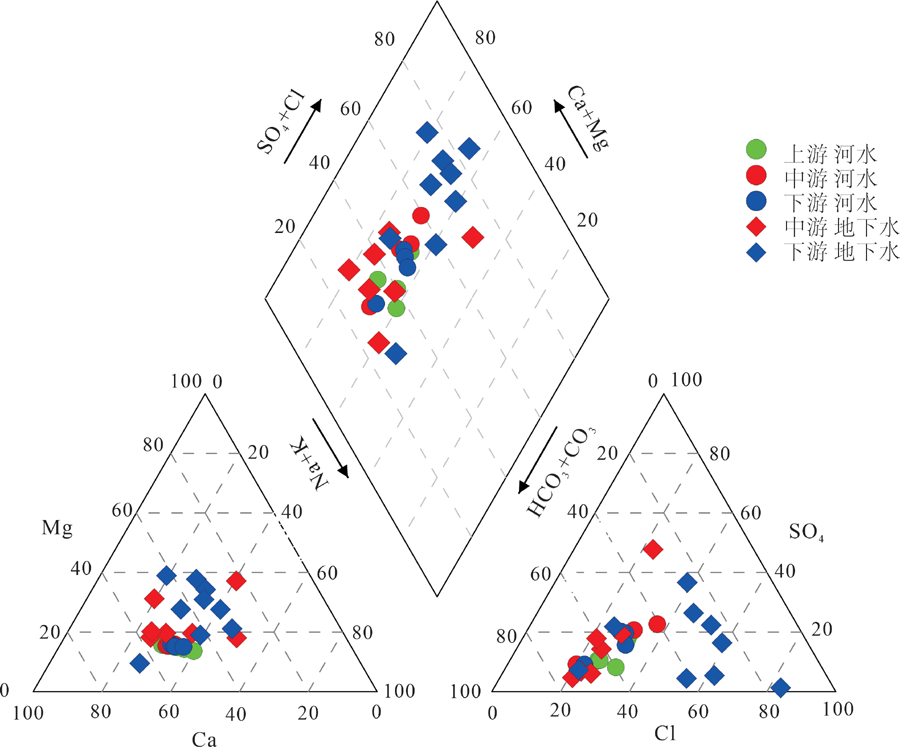
图2 研究区水样Piper三线图
Fig.2 Piper plot of water samples in the study area
| 区域 | 统计量 | pH | TDS | Cl- | S | N | HC | Ca2+ | K+ | Mg2+ | Na+ |
|---|---|---|---|---|---|---|---|---|---|---|---|
| 中游 | 最大值 | 6.94 | 264.00 | 31.16 | 87.25 | 70.90 | 135.93 | 44.49 | 46.72 | 12.54 | 33.06 |
| 最小值 | 6.04 | 57.05 | 9.61 | 4.12 | 0.95 | 40.78 | 9.53 | 1.90 | 2.55 | 4.26 | |
| 平均值 | 6.58 | 156.69 | 21.02 | 24.30 | 17.34 | 85.44 | 26.23 | 12.57 | 8.04 | 15.89 | |
| 标准差 | 0.33 | 72.70 | 8.95 | 29.94 | 25.66 | 33.03 | 14.27 | 15.48 | 3.51 | 10.49 | |
| 变异系数 | 0.05 | 0.46 | 0.43 | 1.23 | 1.48 | 0.39 | 0.54 | 1.23 | 0.44 | 0.66 | |
| 下游 | 最大值 | 7.57 | 263.50 | 74.63 | 50.09 | 88.31 | 108.74 | 57.01 | 17.39 | 25.82 | 45.64 |
| 最小值 | 5.84 | 84.50 | 16.85 | 0.90 | 5.98 | 13.59 | 10.09 | 2.00 | 5.07 | 12.04 | |
| 平均值 | 6.37 | 179.79 | 43.91 | 22.99 | 52.42 | 55.88 | 30.44 | 5.93 | 12.18 | 23.26 | |
| 标准差 | 0.57 | 62.96 | 19.92 | 19.13 | 28.55 | 30.73 | 15.84 | 5.01 | 6.86 | 9.42 | |
| 变异系数 | 0.09 | 0.35 | 0.45 | 0.83 | 0.54 | 0.55 | 0.52 | 0.85 | 0.56 | 0.40 |
表3 研究区地下水水水化学组分
Table 3 Chemical compositions of groundwater samples from the study area
| 区域 | 统计量 | pH | TDS | Cl- | S | N | HC | Ca2+ | K+ | Mg2+ | Na+ |
|---|---|---|---|---|---|---|---|---|---|---|---|
| 中游 | 最大值 | 6.94 | 264.00 | 31.16 | 87.25 | 70.90 | 135.93 | 44.49 | 46.72 | 12.54 | 33.06 |
| 最小值 | 6.04 | 57.05 | 9.61 | 4.12 | 0.95 | 40.78 | 9.53 | 1.90 | 2.55 | 4.26 | |
| 平均值 | 6.58 | 156.69 | 21.02 | 24.30 | 17.34 | 85.44 | 26.23 | 12.57 | 8.04 | 15.89 | |
| 标准差 | 0.33 | 72.70 | 8.95 | 29.94 | 25.66 | 33.03 | 14.27 | 15.48 | 3.51 | 10.49 | |
| 变异系数 | 0.05 | 0.46 | 0.43 | 1.23 | 1.48 | 0.39 | 0.54 | 1.23 | 0.44 | 0.66 | |
| 下游 | 最大值 | 7.57 | 263.50 | 74.63 | 50.09 | 88.31 | 108.74 | 57.01 | 17.39 | 25.82 | 45.64 |
| 最小值 | 5.84 | 84.50 | 16.85 | 0.90 | 5.98 | 13.59 | 10.09 | 2.00 | 5.07 | 12.04 | |
| 平均值 | 6.37 | 179.79 | 43.91 | 22.99 | 52.42 | 55.88 | 30.44 | 5.93 | 12.18 | 23.26 | |
| 标准差 | 0.57 | 62.96 | 19.92 | 19.13 | 28.55 | 30.73 | 15.84 | 5.01 | 6.86 | 9.42 | |
| 变异系数 | 0.09 | 0.35 | 0.45 | 0.83 | 0.54 | 0.55 | 0.52 | 0.85 | 0.56 | 0.40 |
| 区域 | 统计量 | La | Ce | Pr | Nd | Sm | Eu | Gd | Tb | Dy | Ho | Er | Tm | Yb | Lu | REE |
|---|---|---|---|---|---|---|---|---|---|---|---|---|---|---|---|---|
| 上游 | 最大值 | 129 | 172 | 33 | 149 | 64 | 15 | 75 | 16 | 99 | 20 | 66 | 7 | 65 | 9 | 896 |
| 最小值 | 63 | 83 | 13 | 53 | 17 | 4 | 14 | 3 | 21 | 4 | 16 | 1 | 18 | 2 | 338 | |
| 平均值 | 87.8 | 116.8 | 19.8 | 90.2 | 28.4 | 6.5 | 30.2 | 6.4 | 42 | 8.8 | 30 | 2.4 | 32.8 | 4 | 511.6 | |
| 中游 | 最大值 | 58 | 84 | 13 | 53 | 22 | 4 | 25 | 2 | 19 | 5 | 17 | 1 | 23 | 3 | 336 |
| 最小值 | 41 | 67 | 7 | 35 | 11 | 2 | 9 | 1 | 10 | 1 | 9 | 1 | 9 | 1 | 230 | |
| 平均值 | 49.75 | 75.75 | 9.5 | 44.75 | 14.75 | 2.4 | 14.5 | 1.25 | 15 | 3 | 13 | 1 | 15.25 | 2 | 271.75 | |
| 下游 | 最大值 | 159 | 187 | 45 | 207 | 92 | 21 | 103 | 20 | 134 | 23 | 73 | 9 | 71 | 11 | 1 146 |
| 最小值 | 67 | 109 | 15 | 52 | 16 | 2 | 18 | 1 | 23 | 5 | 19 | 1 | 16 | 2 | 360 | |
| 平均值 | 94.75 | 129 | 23 | 98.25 | 36.25 | 7.75 | 42.25 | 7 | 52.25 | 10.25 | 33 | 3.25 | 33.5 | 5 | 580 |
表4 研究区地表水稀土元素含量(ng/L)
Table 4 REE contents of surface water in the study area (ng/L)
| 区域 | 统计量 | La | Ce | Pr | Nd | Sm | Eu | Gd | Tb | Dy | Ho | Er | Tm | Yb | Lu | REE |
|---|---|---|---|---|---|---|---|---|---|---|---|---|---|---|---|---|
| 上游 | 最大值 | 129 | 172 | 33 | 149 | 64 | 15 | 75 | 16 | 99 | 20 | 66 | 7 | 65 | 9 | 896 |
| 最小值 | 63 | 83 | 13 | 53 | 17 | 4 | 14 | 3 | 21 | 4 | 16 | 1 | 18 | 2 | 338 | |
| 平均值 | 87.8 | 116.8 | 19.8 | 90.2 | 28.4 | 6.5 | 30.2 | 6.4 | 42 | 8.8 | 30 | 2.4 | 32.8 | 4 | 511.6 | |
| 中游 | 最大值 | 58 | 84 | 13 | 53 | 22 | 4 | 25 | 2 | 19 | 5 | 17 | 1 | 23 | 3 | 336 |
| 最小值 | 41 | 67 | 7 | 35 | 11 | 2 | 9 | 1 | 10 | 1 | 9 | 1 | 9 | 1 | 230 | |
| 平均值 | 49.75 | 75.75 | 9.5 | 44.75 | 14.75 | 2.4 | 14.5 | 1.25 | 15 | 3 | 13 | 1 | 15.25 | 2 | 271.75 | |
| 下游 | 最大值 | 159 | 187 | 45 | 207 | 92 | 21 | 103 | 20 | 134 | 23 | 73 | 9 | 71 | 11 | 1 146 |
| 最小值 | 67 | 109 | 15 | 52 | 16 | 2 | 18 | 1 | 23 | 5 | 19 | 1 | 16 | 2 | 360 | |
| 平均值 | 94.75 | 129 | 23 | 98.25 | 36.25 | 7.75 | 42.25 | 7 | 52.25 | 10.25 | 33 | 3.25 | 33.5 | 5 | 580 |
| 河流名称 | La | Ce | Nd | Sm | Eu | Tb | Yb | Lu | REE | 参考文献 |
|---|---|---|---|---|---|---|---|---|---|---|
| 长江河源区背景值 | 130 | 150 | 390 | 5 | 3 | - | 30 | 4 | 712 | [ |
| 长江干流中下游 | 35 | 169 | 20 | 16 | 7 | 10 | 7 | 4 | 268 | [ |
| 长江水系背景值 | 50 | 110 | 70 | 13 | 4 | - | 8 | 2 | 257 | [ |
| 珠江广州河段 | 35 | 75 | 50 | 37 | 15 | 10 | 23 | 5 | 250 | [ |
| 松花江水系 | 200 | 160 | 410 | 30 | 7 | 10 | 20 | 4 | 841 | [37] |
| 赣江上游均值 | 113 | 94 | 81 | 12 | 10 | 2 | 7 | 1 | 320 | [ |
| 中国水体 | 60 | 120 | 60 | 10 | 5 | 3 | 8 | 2 | 268 | [ |
| 赣江北支上游 | 88 | 117 | 90 | 28 | 12 | 6 | 33 | 4 | 378 | 本研究 |
| 赣江北支中游 | 50 | 76 | 45 | 15 | 12 | 1 | 15 | 2 | 216 | 本研究 |
| 赣江北支下游 | 95 | 129 | 98 | 36 | 12 | 7 | 34 | 5 | 416 | 本研究 |
| 赣江北支均值 | 78 | 108 | 79 | 27 | 12 | 5 | 28 | 4 | 340 | 本研究 |
表5 我国一些主要河流以及研究区地表水中稀土元素含量(ng/L)
Table 5 REE contents of some major rivers in China and surface water in the study area (ng/L)
| 河流名称 | La | Ce | Nd | Sm | Eu | Tb | Yb | Lu | REE | 参考文献 |
|---|---|---|---|---|---|---|---|---|---|---|
| 长江河源区背景值 | 130 | 150 | 390 | 5 | 3 | - | 30 | 4 | 712 | [ |
| 长江干流中下游 | 35 | 169 | 20 | 16 | 7 | 10 | 7 | 4 | 268 | [ |
| 长江水系背景值 | 50 | 110 | 70 | 13 | 4 | - | 8 | 2 | 257 | [ |
| 珠江广州河段 | 35 | 75 | 50 | 37 | 15 | 10 | 23 | 5 | 250 | [ |
| 松花江水系 | 200 | 160 | 410 | 30 | 7 | 10 | 20 | 4 | 841 | [37] |
| 赣江上游均值 | 113 | 94 | 81 | 12 | 10 | 2 | 7 | 1 | 320 | [ |
| 中国水体 | 60 | 120 | 60 | 10 | 5 | 3 | 8 | 2 | 268 | [ |
| 赣江北支上游 | 88 | 117 | 90 | 28 | 12 | 6 | 33 | 4 | 378 | 本研究 |
| 赣江北支中游 | 50 | 76 | 45 | 15 | 12 | 1 | 15 | 2 | 216 | 本研究 |
| 赣江北支下游 | 95 | 129 | 98 | 36 | 12 | 7 | 34 | 5 | 416 | 本研究 |
| 赣江北支均值 | 78 | 108 | 79 | 27 | 12 | 5 | 28 | 4 | 340 | 本研究 |
| 区域 | 统计量 | La | Ce | Pr | Nd | Sm | Eu | Gd | Tb | Dy | Ho | Er | Tm | Yb | Lu | REE |
|---|---|---|---|---|---|---|---|---|---|---|---|---|---|---|---|---|
| 中游 | 最大值 | 174 | 281 | 53 | 252 | 50 | 8 | 46 | 4 | 33 | 7 | 28 | 3 | 27 | 4 | 985 |
| 最小值 | 55 | 84 | 11 | 52 | 14 | 2 | 9 | 1 | 10 | 1 | 6 | 1 | 3 | 1 | 284 | |
| 平均值 | 91.29 | 150.57 | 21.43 | 99.43 | 23.57 | 3.55 | 22.14 | 1.57 | 19.57 | 3.71 | 14 | 1.29 | 14 | 1.71 | 520.71 | |
| 下游 | 最大值 | 613 | 162 | 92 | 379 | 76 | 15 | 85 | 13 | 66 | 13 | 45 | 6 | 38 | 6 | 1 498 |
| 最小值 | 58 | 52 | 9 | 34 | 11 | 2 | 9 | 1 | 11 | 1 | 7 | 1 | 7 | 1 | 281 | |
| 平均值 | 252.22 | 90 | 39 | 161.11 | 31.78 | 6.27 | 37 | 4.78 | 29.67 | 5.78 | 19.44 | 1.67 | 17 | 2.33 | 733.22 |
表6 研究区地下水稀土元素含量(ng/L)
Table 6 REE contents of groundwater in the study area (ng/L)
| 区域 | 统计量 | La | Ce | Pr | Nd | Sm | Eu | Gd | Tb | Dy | Ho | Er | Tm | Yb | Lu | REE |
|---|---|---|---|---|---|---|---|---|---|---|---|---|---|---|---|---|
| 中游 | 最大值 | 174 | 281 | 53 | 252 | 50 | 8 | 46 | 4 | 33 | 7 | 28 | 3 | 27 | 4 | 985 |
| 最小值 | 55 | 84 | 11 | 52 | 14 | 2 | 9 | 1 | 10 | 1 | 6 | 1 | 3 | 1 | 284 | |
| 平均值 | 91.29 | 150.57 | 21.43 | 99.43 | 23.57 | 3.55 | 22.14 | 1.57 | 19.57 | 3.71 | 14 | 1.29 | 14 | 1.71 | 520.71 | |
| 下游 | 最大值 | 613 | 162 | 92 | 379 | 76 | 15 | 85 | 13 | 66 | 13 | 45 | 6 | 38 | 6 | 1 498 |
| 最小值 | 58 | 52 | 9 | 34 | 11 | 2 | 9 | 1 | 11 | 1 | 7 | 1 | 7 | 1 | 281 | |
| 平均值 | 252.22 | 90 | 39 | 161.11 | 31.78 | 6.27 | 37 | 4.78 | 29.67 | 5.78 | 19.44 | 1.67 | 17 | 2.33 | 733.22 |
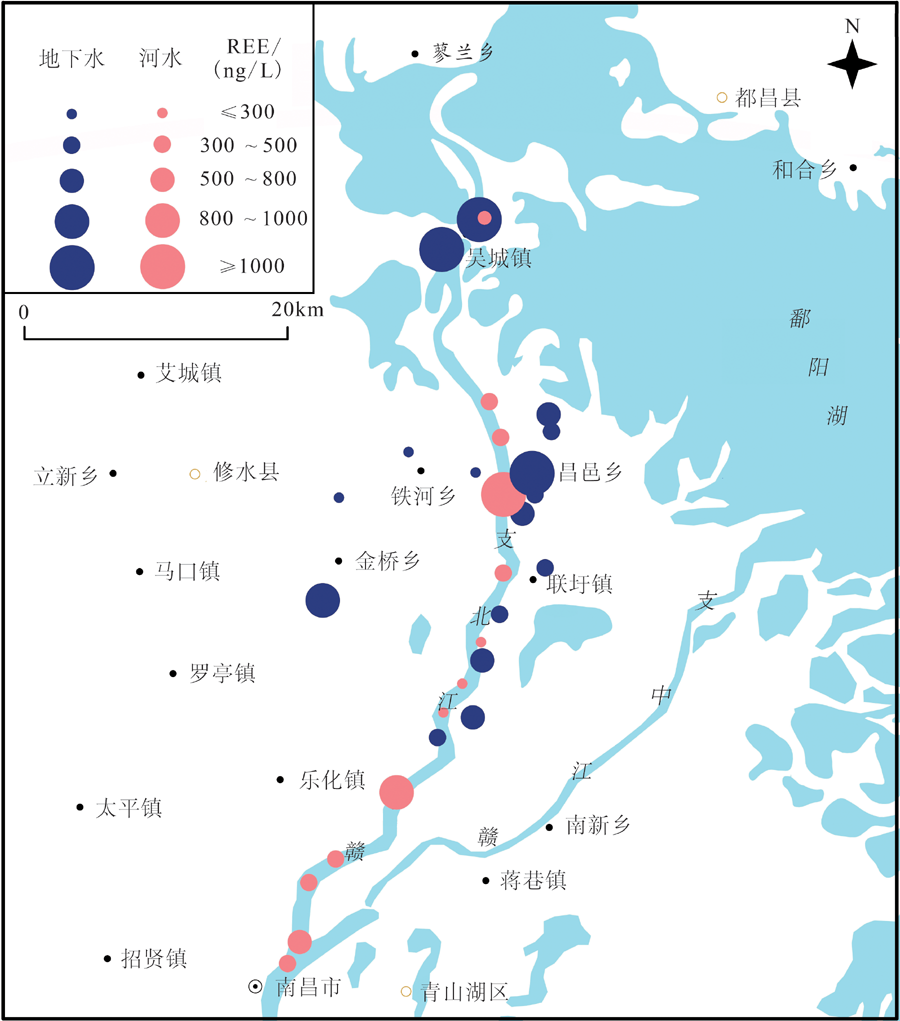
图3 研究区地表水及地下水总稀土元素含量分布
Fig.3 Distributions of total REE concentrations of surface and groundwater in the study area
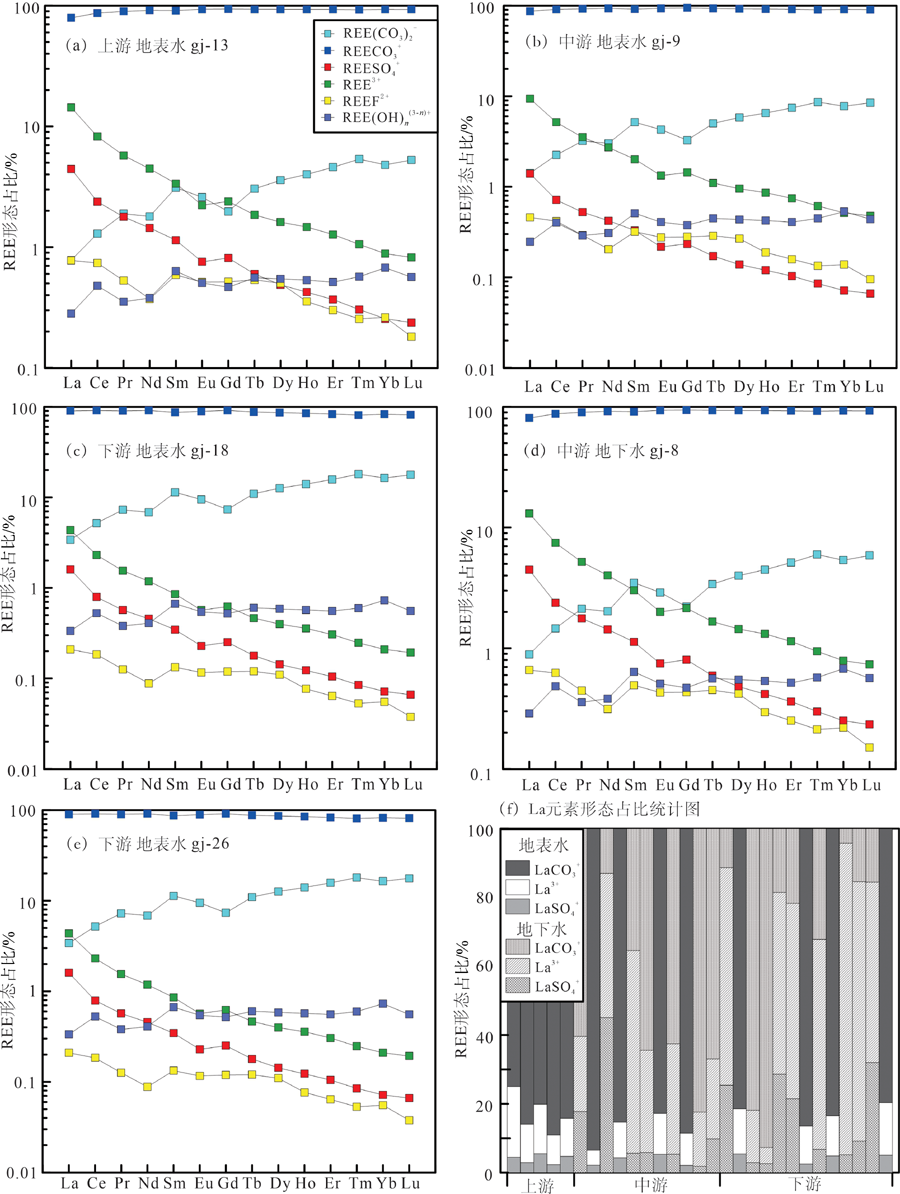
图4 研究区水体中稀土元素形态模拟结果
Fig.4 REE speciation calculation results of water bodies in the study area
| 分区 | 编号 | 距离 /km | (La/ Yb)UCC | (La/ Sm)UCC | (Gd/ Yb)UCC | Ce/ Ce* | Eu/ Eu* |
|---|---|---|---|---|---|---|---|
| 上游 | gj-1 | 0 | 0.28 | 0.60 | 0.58 | 0.64 | 0.84 |
| gj-2 | 1.795 | 0.25 | 0.79 | 0.40 | 0.74 | 0.94 | |
| gj-3 | 6.090 | 0.17 | 0.41 | 0.45 | 0.64 | 0.95 | |
| gj-4 | 8.360 | 0.24 | 0.60 | 0.39 | 0.70 | 0.96 | |
| gj-5 | 14.711 | 0.15 | 0.30 | 0.67 | 0.52 | 0.90 | |
| 中游 | gj-18 | 21.418 | 0.33 | 0.51 | 0.58 | 0.91 | 0.78 |
| gj-10 | 23.913 | 0.24 | 0.53 | 0.54 | 0.81 | 0.64 | |
| gj-28 | 27.181 | 0.27 | 0.70 | 0.41 | 0.81 | 0.73 | |
| gj-9 | 32.334 | 0.18 | 0.40 | 0.63 | 0.70 | 0.65 | |
| 下游 | gj-8 | 37.455 | 0.16 | 0.26 | 0.84 | 0.50 | 0.88 |
| gj-7 | 41.202 | 0.19 | 0.61 | 0.41 | 0.67 | 0.78 | |
| gj-14 | 43.339 | 0.31 | 0.63 | 0.65 | 0.78 | 0.58 | |
| gj-6 | 56.005 | 0.33 | 0.64 | 0.94 | 0.77 | 0.77 |
表7 研究区地表水中稀土元素分异特征参数
Table 7 Fractionation indices for surface water in the study area
| 分区 | 编号 | 距离 /km | (La/ Yb)UCC | (La/ Sm)UCC | (Gd/ Yb)UCC | Ce/ Ce* | Eu/ Eu* |
|---|---|---|---|---|---|---|---|
| 上游 | gj-1 | 0 | 0.28 | 0.60 | 0.58 | 0.64 | 0.84 |
| gj-2 | 1.795 | 0.25 | 0.79 | 0.40 | 0.74 | 0.94 | |
| gj-3 | 6.090 | 0.17 | 0.41 | 0.45 | 0.64 | 0.95 | |
| gj-4 | 8.360 | 0.24 | 0.60 | 0.39 | 0.70 | 0.96 | |
| gj-5 | 14.711 | 0.15 | 0.30 | 0.67 | 0.52 | 0.90 | |
| 中游 | gj-18 | 21.418 | 0.33 | 0.51 | 0.58 | 0.91 | 0.78 |
| gj-10 | 23.913 | 0.24 | 0.53 | 0.54 | 0.81 | 0.64 | |
| gj-28 | 27.181 | 0.27 | 0.70 | 0.41 | 0.81 | 0.73 | |
| gj-9 | 32.334 | 0.18 | 0.40 | 0.63 | 0.70 | 0.65 | |
| 下游 | gj-8 | 37.455 | 0.16 | 0.26 | 0.84 | 0.50 | 0.88 |
| gj-7 | 41.202 | 0.19 | 0.61 | 0.41 | 0.67 | 0.78 | |
| gj-14 | 43.339 | 0.31 | 0.63 | 0.65 | 0.78 | 0.58 | |
| gj-6 | 56.005 | 0.33 | 0.64 | 0.94 | 0.77 | 0.77 |
| 分区 | 编号 | 距离 /km | (La/ Yb)UCC | (La/ Sm)UCC | (Gd/ Yb)UCC | Ce/ Ce* | Eu/ Eu* |
|---|---|---|---|---|---|---|---|
| 中游 | gj-19 | 19.65 | 0.23 | 0.49 | 0.58 | 0.63 | 1.00 |
| gj-30 | 22.323 | 0.64 | 0.66 | 1.07 | 0.85 | 1.36 | |
| gj-29 | 26.109 | 0.38 | 0.56 | 0.90 | 1.04 | 0.71 | |
| gj-13 | 26.525 | 0.47 | 0.52 | 0.99 | 0.67 | 1.18 | |
| gj-27 | 29.630 | 1.34 | 0.59 | 2.32 | 0.79 | 1.56 | |
| gj-17 | 34.054 | 0.77 | 0.63 | 0.87 | 0.73 | 0.94 | |
| gj-26 | 34.219 | 0.67 | 0.78 | 1.01 | 0.91 | 1.56 | |
| 下游 | gj-25 | 36.800 | 0.39 | 0.62 | 0.90 | 0.80 | 0.83 |
| gj-15 | 38.165 | 1.47 | 1.91 | 0.74 | 0.33 | 0.94 | |
| gj-16 | 38.194 | 0.39 | 0.62 | 0.63 | 0.51 | 1.56 | |
| gj-24 | 38.445 | 0.42 | 0.63 | 0.79 | 0.46 | 0.65 | |
| gj-23 | 39.723 | 1.00 | 1.18 | 1.13 | 0.12 | 0.79 | |
| gj-22 | 43.071 | 0.66 | 0.76 | 1.35 | 0.35 | 0.99 | |
| gj-21 | 44.096 | 1.01 | 0.96 | 1.30 | 0.46 | 0.80 | |
| gj-12 | 53.064 | 1.33 | 1.03 | 1.70 | 0.12 | 0.88 | |
| gj-11 | 55.795 | 2.81 | 2.55 | 2.13 | 0.09 | 1.08 |
表8 研究区地下水中稀土元素分异特征参数
Table 8 Fractionation indices for groundwater in the study area
| 分区 | 编号 | 距离 /km | (La/ Yb)UCC | (La/ Sm)UCC | (Gd/ Yb)UCC | Ce/ Ce* | Eu/ Eu* |
|---|---|---|---|---|---|---|---|
| 中游 | gj-19 | 19.65 | 0.23 | 0.49 | 0.58 | 0.63 | 1.00 |
| gj-30 | 22.323 | 0.64 | 0.66 | 1.07 | 0.85 | 1.36 | |
| gj-29 | 26.109 | 0.38 | 0.56 | 0.90 | 1.04 | 0.71 | |
| gj-13 | 26.525 | 0.47 | 0.52 | 0.99 | 0.67 | 1.18 | |
| gj-27 | 29.630 | 1.34 | 0.59 | 2.32 | 0.79 | 1.56 | |
| gj-17 | 34.054 | 0.77 | 0.63 | 0.87 | 0.73 | 0.94 | |
| gj-26 | 34.219 | 0.67 | 0.78 | 1.01 | 0.91 | 1.56 | |
| 下游 | gj-25 | 36.800 | 0.39 | 0.62 | 0.90 | 0.80 | 0.83 |
| gj-15 | 38.165 | 1.47 | 1.91 | 0.74 | 0.33 | 0.94 | |
| gj-16 | 38.194 | 0.39 | 0.62 | 0.63 | 0.51 | 1.56 | |
| gj-24 | 38.445 | 0.42 | 0.63 | 0.79 | 0.46 | 0.65 | |
| gj-23 | 39.723 | 1.00 | 1.18 | 1.13 | 0.12 | 0.79 | |
| gj-22 | 43.071 | 0.66 | 0.76 | 1.35 | 0.35 | 0.99 | |
| gj-21 | 44.096 | 1.01 | 0.96 | 1.30 | 0.46 | 0.80 | |
| gj-12 | 53.064 | 1.33 | 1.03 | 1.70 | 0.12 | 0.88 | |
| gj-11 | 55.795 | 2.81 | 2.55 | 2.13 | 0.09 | 1.08 |
| 区域 | 统计量 | La | Ce | Pr | Nd | Sm | Eu | Gd | Tb | Dy | Ho | Er | Tm | Yb | Lu | REE | LREE/ HREE |
|---|---|---|---|---|---|---|---|---|---|---|---|---|---|---|---|---|---|
| 中游 | 最大值 | 55.80 | 119.50 | 12.10 | 44.80 | 9.21 | 1.44 | 7.90 | 1.22 | 7.27 | 1.47 | 4.39 | 0.67 | 4.27 | 0.66 | 270.70 | 8.72 |
| 最小值 | 36.50 | 78.30 | 8.12 | 29.40 | 6.08 | 0.88 | 5.18 | 0.82 | 4.93 | 1.00 | 2.98 | 0.44 | 2.82 | 0.45 | 177.90 | 8.55 | |
| 平均值 | 46.37 | 100.43 | 10.19 | 37.67 | 7.72 | 1.22 | 6.69 | 1.04 | 6.20 | 1.25 | 3.72 | 0.56 | 3.52 | 0.55 | 227.12 | 8.65 | |
| 下游 | 最大值 | 48.20 | 105.50 | 12.30 | 44.60 | 8.68 | 1.33 | 6.80 | 1.10 | 6.43 | 1.34 | 3.87 | 0.57 | 3.86 | 0.60 | 244.98 | 8.97 |
| 最小值 | 41.30 | 91.60 | 9.69 | 36.40 | 7.07 | 1.13 | 6.24 | 0.97 | 5.86 | 1.18 | 3.40 | 0.52 | 3.19 | 0.51 | 209.26 | 8.57 | |
| 平均值 | 45.37 | 98.57 | 10.71 | 39.80 | 7.82 | 1.23 | 6.61 | 1.05 | 6.18 | 1.26 | 3.66 | 0.54 | 3.50 | 0.55 | 226.85 | 8.71 |
表9 研究区沉积物中稀土元素含量(mg/kg )
Table 9 Sediment REE contents of the study area (mg/kg)
| 区域 | 统计量 | La | Ce | Pr | Nd | Sm | Eu | Gd | Tb | Dy | Ho | Er | Tm | Yb | Lu | REE | LREE/ HREE |
|---|---|---|---|---|---|---|---|---|---|---|---|---|---|---|---|---|---|
| 中游 | 最大值 | 55.80 | 119.50 | 12.10 | 44.80 | 9.21 | 1.44 | 7.90 | 1.22 | 7.27 | 1.47 | 4.39 | 0.67 | 4.27 | 0.66 | 270.70 | 8.72 |
| 最小值 | 36.50 | 78.30 | 8.12 | 29.40 | 6.08 | 0.88 | 5.18 | 0.82 | 4.93 | 1.00 | 2.98 | 0.44 | 2.82 | 0.45 | 177.90 | 8.55 | |
| 平均值 | 46.37 | 100.43 | 10.19 | 37.67 | 7.72 | 1.22 | 6.69 | 1.04 | 6.20 | 1.25 | 3.72 | 0.56 | 3.52 | 0.55 | 227.12 | 8.65 | |
| 下游 | 最大值 | 48.20 | 105.50 | 12.30 | 44.60 | 8.68 | 1.33 | 6.80 | 1.10 | 6.43 | 1.34 | 3.87 | 0.57 | 3.86 | 0.60 | 244.98 | 8.97 |
| 最小值 | 41.30 | 91.60 | 9.69 | 36.40 | 7.07 | 1.13 | 6.24 | 0.97 | 5.86 | 1.18 | 3.40 | 0.52 | 3.19 | 0.51 | 209.26 | 8.57 | |
| 平均值 | 45.37 | 98.57 | 10.71 | 39.80 | 7.82 | 1.23 | 6.61 | 1.05 | 6.18 | 1.26 | 3.66 | 0.54 | 3.50 | 0.55 | 226.85 | 8.71 |
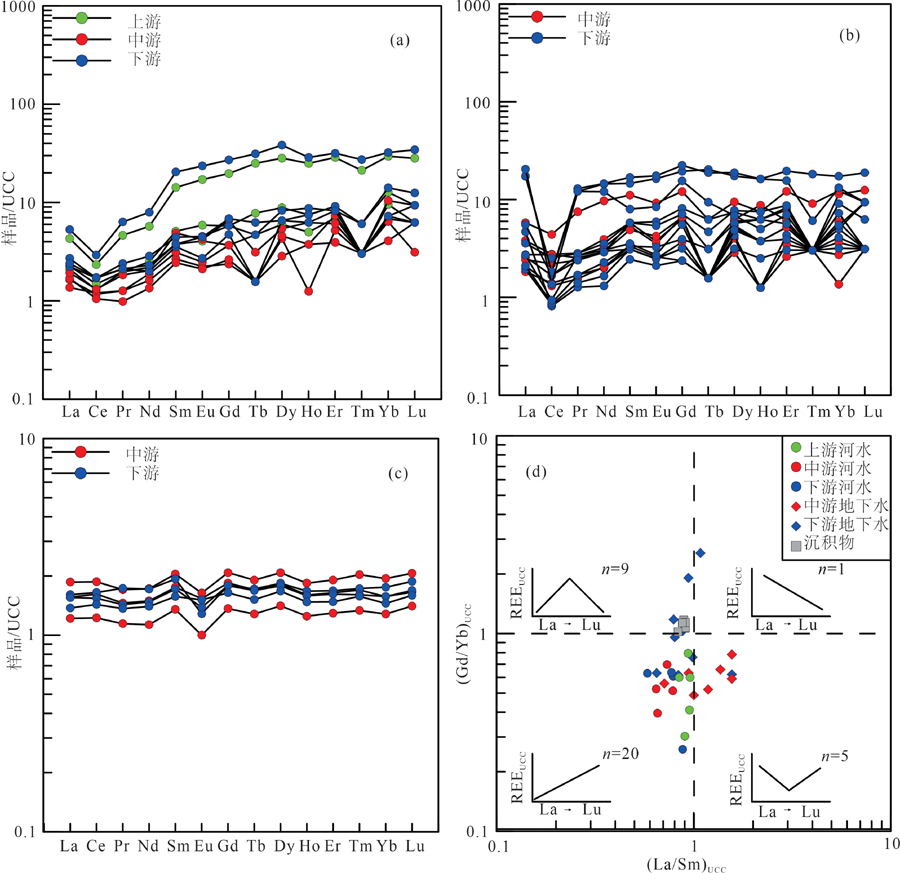
图5 研究区地表水(a)、地下水(b)和沉积物(c)平均上陆壳(UCC)标准化稀土元素配分模式以及稀土元素的分异(d)
Fig.5 UCC-normalized patterns for surface water (a), groundwater (b) and sediment (c) in the study area, and their fractionation characteristics (d)
| 分区 | 编号 | 距离 /km | (La/ Yb)UCC | (La/ Sm)UCC | (Gd/ Yb)UCC | Ce/ Ce* | Eu/ Eu* |
|---|---|---|---|---|---|---|---|
| c-1 | 21.418 | 0.99 | 0.89 | 1.17 | 1.07 | 0.85 | |
| 中游 | c-2 | 23.913 | 0.95 | 0.90 | 1.06 | 1.04 | 0.74 |
| c-3 | 32.334 | 0.96 | 0.91 | 1.07 | 1.05 | 0.79 | |
| c-4 | 37.455 | 0.92 | 0.83 | 1.02 | 0.99 | 0.69 | |
| 下游 | c-5 | 43.339 | 0.99 | 0.91 | 1.14 | 1.03 | 0.79 |
| c-6 | 56.005 | 0.95 | 0.88 | 1.13 | 1.04 | 0.94 |
表10 研究区沉积物中稀土元素分异特征参数
Table 10 Fractionation indices for sediments in the study area
| 分区 | 编号 | 距离 /km | (La/ Yb)UCC | (La/ Sm)UCC | (Gd/ Yb)UCC | Ce/ Ce* | Eu/ Eu* |
|---|---|---|---|---|---|---|---|
| c-1 | 21.418 | 0.99 | 0.89 | 1.17 | 1.07 | 0.85 | |
| 中游 | c-2 | 23.913 | 0.95 | 0.90 | 1.06 | 1.04 | 0.74 |
| c-3 | 32.334 | 0.96 | 0.91 | 1.07 | 1.05 | 0.79 | |
| c-4 | 37.455 | 0.92 | 0.83 | 1.02 | 0.99 | 0.69 | |
| 下游 | c-5 | 43.339 | 0.99 | 0.91 | 1.14 | 1.03 | 0.79 |
| c-6 | 56.005 | 0.95 | 0.88 | 1.13 | 1.04 | 0.94 |
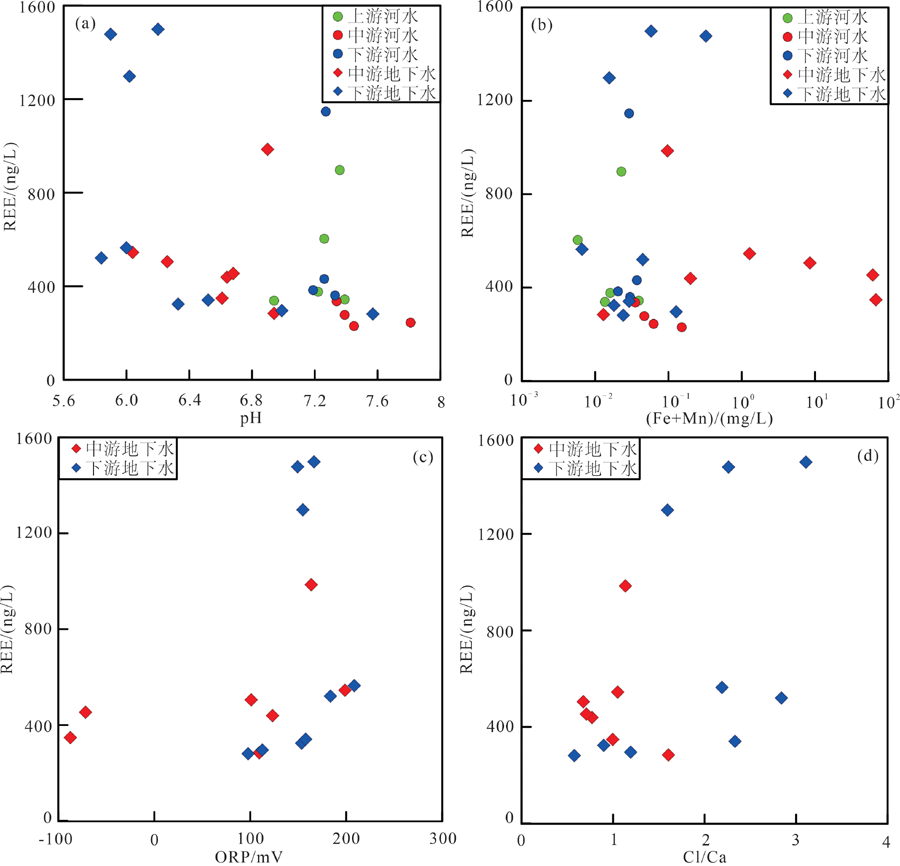
图6 研究区水体中REE含量与pH(a)、Fe+Mn含量(b)的关系以及地下水中REE含量与ORP(c)、Cl/ Ca(d)的关系
Fig.6 Relationships between REE content and pH (a), Fe+Mn content (b), ORP (c) and Cl/ Ca (d) in the water samples of the study area

图7 研究区水样点的Gibbs图 (a)阳离子;(b)阴离子
Fig.7 Gibbs diagrams of water samples from the study area
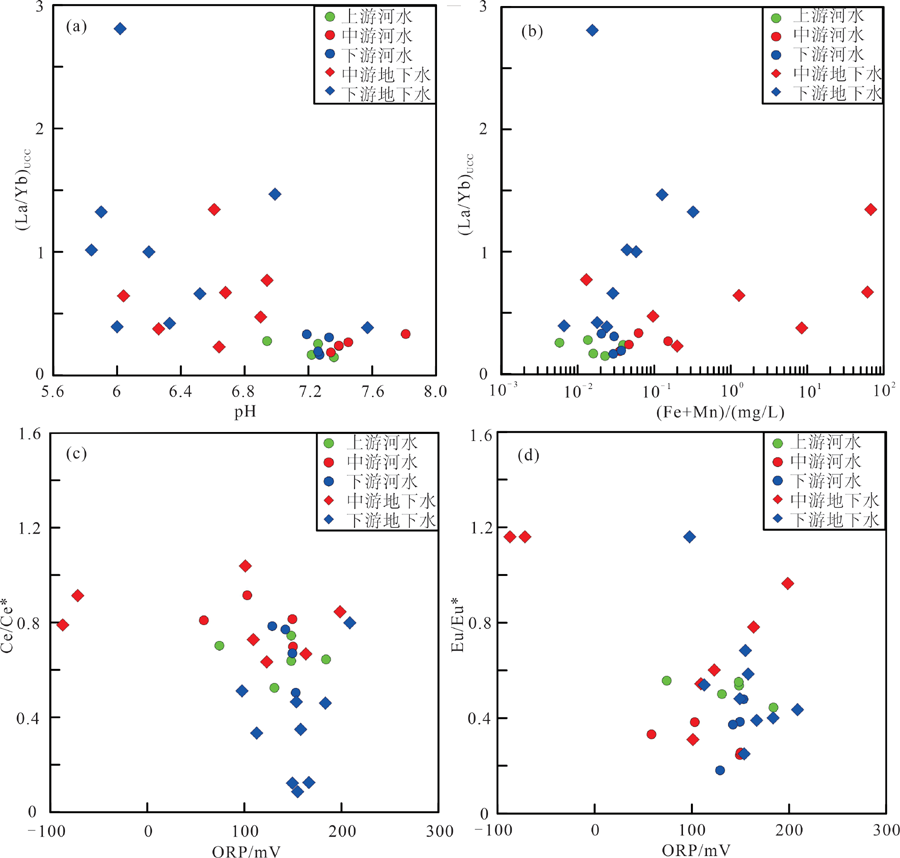
图8 研究区水体中(La/Yb)UCC含量与pH(a)、Fe+Mn含量(b)的关系以及水体中ORP与Ce/Ce*(c)、Eu/Eu*(d)的变化关系
Fig.8 Plots of (La/Yb)UCC vs. pH (a), (La/Yb)UCC vs. (Fe+Mn) (b), Ce/Ce* vs. ORP (c), and Eu/Eu* vs. ORP (d) for the water samples from the study area
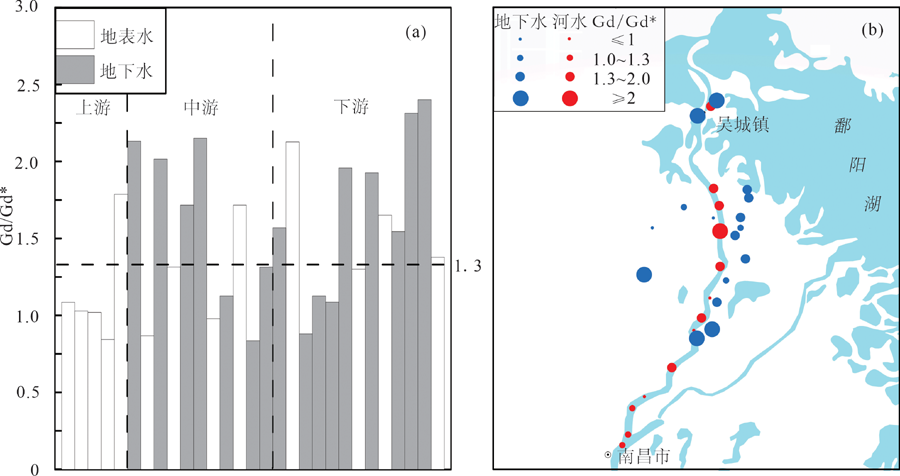
图9 研究区水体中的Gd异常(Gd/Gd*) 统计直方图(a)以及分布图(b)
Fig.9 Gd anomalies statistical histogram (a) and distribution chart (b) in water samples from the study area
| [1] | CONNELLY N G, DAMHUS T, HARTSHORN R M, et al. Nomenclature of Inorganic Chemistry: IUPAC Recommendations 2005[M]. Berlin: RSC, 2005. |
| [2] | BARRETT S D, DHESI S S. The Structure of Rare-Earth Metal Surfaces[M]. Liverpool: University of Liverpool, 2001. |
| [3] | VONCKEN J. The Rare Earth Elements-An Introduction[M]. New York: Springer Briefs in Earth, 2016. |
| [4] | 彭安, 朱建国. 稀土元素的环境化学及生态效应[M]. 北京: 中国环境科学出版社, 2003. |
| [5] | JOHANNESSON K H, STETZENBACH K, HODGE V. Rare earth elements as geochemical tracers of regional groundwater mixing[J]. Geochimica et Cosmochimica Acta, 1997, 61(17): 3605-3618. |
| [6] | TANG J, JOHANNESSON K H. Controls on the geochemistry of rare earth elements along a groundwater flow path in the Carrizo Sand aquifer, Texas, USA[J]. Chemical Geology, 2006, 225(1/2): 156-171. |
| [7] | CHEVIS D A, JOHANNESSON K H, BURDIGE D J, et al. Submarine groundwater discharge of rare earth elements to a tidally-mixed estuary in Southern Rhode Island[J]. Chemical Geology, 2015, 397: 128-142. |
| [8] | 周海玲, 苏春利, 李俊霞, 等. 大同盆地沉积物REE分布特征及其对碘富集的指[J]. 地球科学, 2017, 42(2): 298-306. |
| [9] | WILLIS S S. Trace element geochemistry in groundwater flow systems[D]. Arlington: The University of Texas, 2010. |
| [10] | DECRÉE S, POURRET O, BAELE J M. Rare earth element fractionation in heterogenite (CoOOH): implication for cobalt oxidized ore in the Katanga Copperbelt (Democratic Republic of Congo)[J]. Journal of Geochemical Exploration, 2015, 159: 290-301. |
| [11] | GUO H M, BO Z, WANG G, et al. Geochemical controls on arsenic and rare earth elements approximately along a groundwater flow path in the shallow aquifer of the Hetao Basin, Inner Mongolia[J]. Chemical Geology, 2010, 270(1/4): 117-125. |
| [12] | 李传琼. 赣江水系水化学分布特征及成分来源[D]. 南昌: 江西师范大学, 2018. |
| [13] | 于扬, 李德先, 王登红, 等. 溶解态稀土元素在离子吸附型稀土矿区周边地表水中的分布特征及影响因素[J]. 地学前缘, 2017, 24(5):172-181. |
| [14] | 孟秀丽. 赣南小流域水体中溶解态稀土元素地球化学特征[J]. 中国稀土学报, 2007, 25(5):625-631. |
| [15] | 罗建美. 赣南小流域水体中溶解态稀土元素的地球化学特征[D]. 北京: 首都师范大学, 2006. |
| [16] | 周刚, 黑鹏飞, 雷坤, 等. 赣江下游污染负荷与水质响应关系模型[J]. 水科学进展, 2013, 24(6):883-893. |
| [17] | 胡锋平, 侯娟, 罗健文, 等. 赣江南昌段污染负荷及水环境容量分析[J]. 环境科学与技术, 2010, 33(12):192-195. |
| [18] | 李传琼, 王鹏, 李燕, 等. 赣江水系水化学时空特征及影响因素[J]. 环境化学, 2017, 36(9):1949-1957. |
| [19] | 涂正革. 环境、 资源与工业增长的协调性[J]. 经济研究, 2008(2):93-105. |
| [20] | 孙才志, 王雪妮, 邹玮. 基于WPI-LSE模型的中国水贫困测度及空间驱动类型分析[J]. 经济地理, 2012, 32(3):9-15. |
| [21] | 张大文, 张莉, 何俊海, 等. 鄱阳湖溶解态重金属空间分布格局及风险评估[J]. 生态学报, 2015, 35(24):8028-8035. |
| [22] | 李燕, 王鹏, 陈波, 等. 赣江南昌段水化学特征及城区影响[J]. 长江流域资源与环境, 2018, 27(2):386-394. |
| [23] | 计勇, 张洁, 樊后保, 等. 赣江中下游城市断面重金属分布特征及生态风险评价[J]. 中国农村水利水电, 2013, 5(5):42-42. |
| [24] | 李甜甜, 季宏兵, 江用彬, 等. 赣江上游河流水化学的影响因素及DIC来源[J]. 地理学报, 2007(7):764-775. |
| [25] | 廖瑞君, 衷存堤, 肖晓林. 江西陆相红盆岩石地层划分与对比[J]. 江西地质, 2001(3):166-170. |
| [26] | PARKHURST D L. Description of input and examples for PHREEQC Version 3: A computer program for speciation, batch-reaction, one-dimensional transport, and inverse geochemical calculations[R]. Wisconsin: Center for Integrated Data Analytics Science, 2013. |
| [27] | KLUNGNESS G D, BYRNE R H. Comparative hydrolysis beha-vior of the rare earths and yttrium: the influence of temperature and ionic strength[J]. Polyhedron, 2000, 19(1): 99-107. |
| [28] | LEE J H, BYRNE R H. Examination of comparative rare earth element complexation behavior using linear free-energy relationships[J]. Pergamon, 1992, 56(3): 1127-1137 |
| [29] | LUO Y R, BYRNE R H. Carbonate complexation of yttrium and the rare earth elements in natural waters[J]. Geochimica et Cosmochimica Acta, 2004, 68(4): 690-699. |
| [30] | SCHIJF J, BYRNE R H. Determination of SO4β1 for yttrium and the rare earth elements at I=0.66 m and t=25 ℃: implications for YREE solution speciation in sulfate-rich waters[J]. Geochimica et Cosmochimica Acta, 2004, 68(13): 2825-2837. |
| [31] | MILLERO F J. Stability constants for the formation of rare earth-inorganic complexes as a function of ionic strength[J]. Pergamon, 1992, 56(8): 3123-3132. |
| [32] | MIGDISOV A A, WILLIAMS-JONES A E, WAGNER T. An experimental study of the solubility and speciation of the Rare Earth Elements (III) in fluoride and chloride-bearing aqueous solutions at temperatures up to 300 ℃[J]. Geochimica et Cosmochimica Acta, 2009, 73(23): 7087-7109. |
| [33] | 张立成. 长江河源区水环境地球化学[M]. 北京: 中国环境科学出版社, 1992. |
| [34] | 王立军, 李岫霞, 章申, 等. 长江武汉江段水体中稀土元素的含量和形态[J]. 地理学报, 1994(4): 353-362. |
| [35] | 王立军, 章申, 张朝生, 等. 长江中下游稀土元素的水环境地球化学特征[J]. 环境科学学报, 1995, 49(1):57-65. |
| [36] | WANG L, ZHANG S, ZHANG C, et al. Geochemical characteristics of rare earth elements in Wuhan section of the Yangtze River[J]. Journal of Environmental Sciences, 1995, 2(1):44-51. |
| [37] | 王立军, 张朝生, 章申, 等. 珠江广州江段水体中稀土元素的地球化学特征[J]. 地理学报, 1998(5): 71-80. |
| [38] | LIU H Y, GUO H M, XING L, et al. Geochemical behaviors of rare earth elements in groundwater along a flow path in the North China Plain[J]. Journal of Asian Earth Sciences, 2016, 117: 33-51. |
| [39] | 谢先军, 王焰新, 李俊霞, 等. 大同盆地高砷地下水稀土元素特征及其指示意义[J]. 地球科学, 2012, 37(2):381-390. |
| [40] | 王慧群, 胡斌, 滕彦国, 等. 拉林河流域地下水中稀土元素质量浓度及分异特征[J]. 南水北调与水利科技, 2021, 19(1):158-167. |
| [41] | MCLENNAN S M. Relationships between the trace element composition of sedimentary rocks and upper continental crust[J]. Geochemistry, Geophysics, Geosystems, 2001, 2(4): 2000GC000109. |
| [42] | YANG S Y, JUNG H S, CHOI M S, et al. The rare earth element compositions of the Changjiang (Yangtze) and Huanghe (Yellow) river sediments[J]. Earth and Planetary Science Letters, 2002, 201(2): 407-419. |
| [43] | WANG L Q, HAN X X, LIANG T, et al. Discrimination of rare earth element geochemistry and co-occurrence in sediment from Poyang Lake, the largest freshwater lake in China[J]. Chemosphere, 2019, 217: 851-857. |
| [44] | XU Z, HAN G. Rare earth elements (REE) of dissolved and suspended loads in the Xijiang River, South China[J]. Applied Geochemistry, 2009, 24(9):1803-1816. |
| [45] | 丁士明, 梁涛, 王立军, 等. 陆地水体中溶解态稀土元素的分布特征及主控因素研究进展[J]. 稀土, 2005(4):53-61. |
| [46] | 刘海燕. 华北平原典型区地下水稀土元素的分布特征及其与铁、锰络合反应的模拟研究[D]. 北京: 中国地质大学(北京), 2018. |
| [47] | 沈照理. 水文地球化学基础[M]. 北京: 地质出版社, 1986: 83-98. |
| [48] | DUPRÉ B, GAILLARDET J, ROUSSEAU D, et al. Major and trace elements of river-borne material: The Congo Basin[J]. Geochimica et Cosmochimica Acta, 1996, 60(8): 1301-1321. |
| [49] | LAVEUF C, CORNU S. A review on the potentiality of rare earth elements to trace pedogenetic processes[J]. Geoderma, 2009, 154(1): 1-12. |
| [50] | BRIOSCHI L, STEINMANN M, LUCOT E, et al. Transfer of rare earth elements (REE) from natural soil to plant systems: implications for the environmental availability of anthropogenic REE[J]. Plant and Soil, 2013, 366(1/2): 143-163. |
| [51] | BROOKINS D G. Aqueous geochemistry of rare earth elements[J]. Geochemistry & Mineralogy of Rare Earth Elements, 1989, 21(1): 201-225. |
| [52] | BAU M, DULSKI P. Anthropogenic origin of positive gadolinium anomalies in river waters[J]. Earth and Planetary Science Letters, 1996, 143(1):245-255. |
| [53] | KÜMMERER K, HELMERS E. Hospital effluents as a source of gadolinium in the aquatic environment[J]. Environmental Science and Technology, 2000, 34(4): 573-577. |
| [54] | MÖLLER P, MORTEANI G, DULSKI P. Anomalous Gadolinium, Cerium and Yttrium Contents in the Adige and Isarco River Waters and in the Water of Their Tributaries Provinces Trento and Bolzano/Bozen, NE Italy)[J]. Acta Hydrochimica et Hydrobiologica, 2003, 31(3): 225-239. |
| [55] | VERPLANCK P L, TAYLOR H E, NORDSTROM D K, et al. Aqueous stability of gadolinium in surface waters receiving sewage treatment plant effluent, Boulder Creek, Colorado[J]. Environmental Science and Technology, 2005, 39(18): 6923-6929. |
| [56] | RABIET M, BRISSAUD F, SEIDEL J L, et al. Positive gadolinium anomalies in wastewater treatment plant effluents and aquatic environment in the Hérault watershed (South France)[J]. Chemosphere, 2009, 75(8): 1057-1064. |
| [1] | 王启博, 张寿庭, 唐利, 李军军, 盛渊明. 豫西杨山萤石矿床成因:萤石稀土元素组成和流体包裹体热力学制约[J]. 现代地质, 2023, 37(06): 1524-1537. |
| [2] | 张卓, 陈社明, 柳富田, 高志鹏, 牛笑童. 滨海平原区深层高氟地下水富集机理:以滦河三角洲为例[J]. 现代地质, 2023, 37(04): 925-932. |
| [3] | 杜贯新, 闫百泉, 孙雨, 钱程, 秦涛, 臧延庆. 松嫩平原黑土区西北部阿荣旗地下黑土稀土元素特征及环境指示[J]. 现代地质, 2023, 37(03): 813-820. |
| [4] | 王艺璇, 周训, 陈梦颖, 马静茹, 海阔, 肖萌, 尚子琦, 张颖, 余鸣潇. 河北北部四处温泉的水化学特征及成因分析[J]. 现代地质, 2022, 36(02): 494-506. |
| [5] | 吴小雷, 常晋阳, 曾南石, 徐文杰, 陶明荣, 赵刚, 韩建. 辽宁红透山铜锌矿床含矿岩系地球化学特征及找矿指示[J]. 现代地质, 2022, 36(01): 362-377. |
| [6] | 远继东, 姜正龙, 代友旭, 郝连成, 张健康, 张德程, 郑立龙. 湛江湾海域表层沉积物稀土元素特征及其物源指示意义[J]. 现代地质, 2022, 36(01): 77-87. |
| [7] | 赵保具, 张艳飞, 颜开, 肖荣阁. 大兴安岭中段有色金属矿床成矿物质来源探讨[J]. 现代地质, 2021, 35(05): 1380-1396. |
| [8] | 王珍珍, 李进孝, 张珂, 郭文牧, 张绍韡, 肖林. 山西西铭煤矿煤中稀土元素地球化学特征及指示意义[J]. 现代地质, 2021, 35(04): 1009-1017. |
| [9] | 赵保具, 颜开, 肖荣阁. 一种稀土参数图解新方法:以内蒙古拜仁达坝-维拉斯托闪长岩成因研究为例[J]. 现代地质, 2021, 35(03): 608-624. |
| [10] | 斯扬, 张文选, 罗安湘, 孙勃, 朱玉双. 鄂尔多斯盆地陇东地区长8致密砂岩油藏地层水化学特征成因及其油气指示意义[J]. 现代地质, 2019, 33(05): 1106-1117. |
| [11] | 惠小朝, 蔡煜琦, 何升, 冯张生. 陕西省华阳川铀铌铅矿床碳酸岩岩石学及地球化学特征[J]. 现代地质, 2017, 31(02): 246-257. |
| [12] | 杨帆,宋云涛,张舜尧,郝志红,郭志娟,王成文,岑况. 内蒙古大石寨地区稀土元素的区域分布特征[J]. 现代地质, 2016, 30(4): 802-810. |
| [13] | 李景运,马生明,席明杰,陈宏强. 浙江江山—绍兴断裂带陈蔡群微量元素地球化学特征及其与成矿的关系[J]. 现代地质, 2016, 30(3): 493-502. |
| [14] | 李小聪,王安东,万建军,李全忠,林乐夫. 赣江流域(南昌段)水系沉积物物源示踪研究:来自锆石U-Pb同位素证据的约束[J]. 现代地质, 2016, 30(3): 514-527. |
| [15] | 高志勇,周川闽,董文彤,白斌,李雯. 浅水三角洲动态生长过程模型与有利砂体分布—以鄱阳湖赣江三角洲为例[J]. 现代地质, 2016, 30(2): 341-352. |
| 阅读次数 | ||||||
|
全文 |
|
|||||
|
摘要 |
|
|||||