

现代地质 ›› 2025, Vol. 39 ›› Issue (01): 1-7.DOI: 10.19657/j.geoscience.1000-8527.2024.101
赵迪1( ), 刘鑫1(), 赵大鹏2
出版日期:2025-02-10
发布日期:2025-02-20
通信作者:
刘 鑫,男,博士,副教授,1985年出生,海洋地质专业,主要从事地球深部构造研究。Email:liuxin@ouc.edu.cn。作者简介:赵 迪,男,硕士研究生,1999年出生,地质学专业,主要从事地球深部构造研究。Email:zhaodi36524@163.com。
基金资助:
ZHAO Di1(), LIU Xin1(), ZHAO Dapeng2
Published:2025-02-10
Online:2025-02-20
摘要:
位于西南太平洋的汤加俯冲带发育有世界上最典型的“沟-弧-盆”体系,该区域不仅具有全球最快的板块俯冲速度,还发育扩张速率最快的弧后盆地——劳盆地。汤加俯冲带东北侧的萨摩亚地幔柱也与该俯冲系统间存在着强烈的相互作用,这使得该区的地幔动力过程更加复杂。虽然前人已在此进行了许多地球物理研究,但汤加俯冲带上地幔的精细三维结构,尤其是各向异性结构特征仍不清晰。为此,本文利用20~150 s周期范围内的远震基阶瑞利波的振幅和相位数据开展了方位各向异性层析成像研究,以期进一步约束汤加地区上地幔速度结构。研究结果认为:(1)萨摩亚地幔柱物质向南流入劳盆地主要发生在小于50 km的深度范围内;(2)劳盆地北部地幔楔中主要呈现东西向的地幔流动,而南部则存在南北向的地幔流动,这可能是地幔物质被动流动以适应俯冲板块不对称回卷的结果;(3)俯冲板片内主要呈现近南北向的快波方向,这可能与俯冲相关的正断层有关;(4)海沟外侧软流圈中存在平行海沟的横向地幔流动,这可能是软流圈物质受俯冲板块回卷挤压产生的。
中图分类号:
赵迪, 刘鑫, 赵大鹏. 汤加俯冲带上地幔剪切波速度和方位各向异性结构[J]. 现代地质, 2025, 39(01): 1-7.
ZHAO Di, LIU Xin, ZHAO Dapeng. Shear-wave Velocity and Azimuthal Anisotropy in the Upper Mantle of the Tonga Subduction Zone[J]. Geoscience, 2025, 39(01): 1-7.
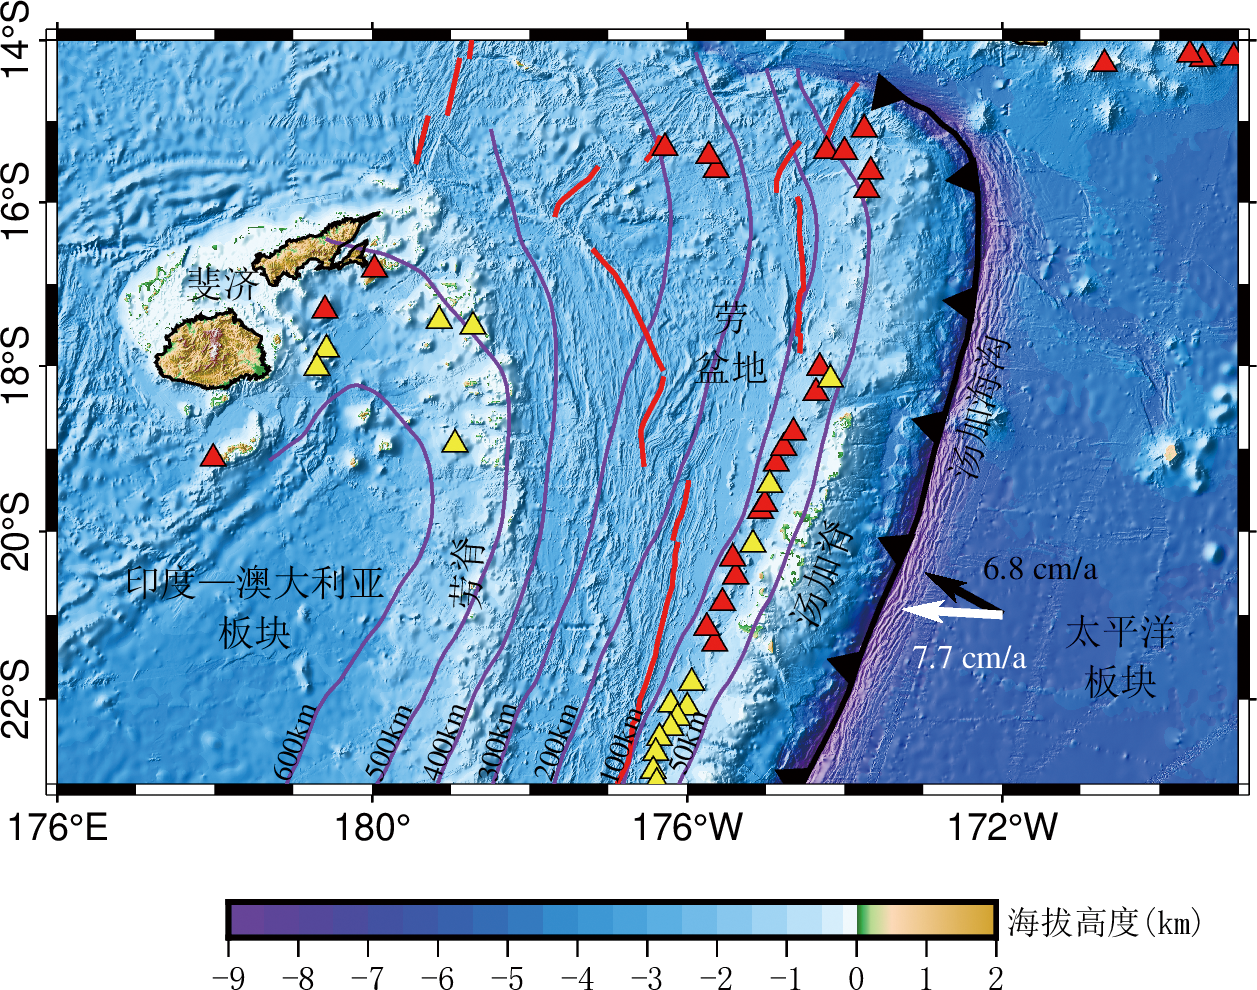
图1 汤加—劳—斐济地区构造背景图 红色和黄色三角形分别表示全新世和更新世火山;紫色线表示俯冲板片上表面等深线;红色线表示弧后扩张中心;黑色锯齿线代表汤加海沟;黑白箭头分别表示太平洋板块的绝对和相对澳大利亚板块的运动速度
Fig.1 Tectonic setting background in the Tonga-Lau-Fiji region

图2 研究使用的地震台站分布图 正方形表示陆地台站;圆形表示海底地震仪;其余图例与图1相同
Fig.2 Distribution of seismic stations used in this study

图3 瑞利波数据处理示例 (a)地震台站和远震事件位置示意图;(b)三分量地震波形;(c)高斯滤波前(红色线)、后(黑色线)各周期瑞利波,紫色线为包络线;(d)包络线归一化振幅图,粉色菱形代表选取的群速度到时
Fig.3 An example of measuring Rayleigh-wave data

图4 研究使用的1088个远震事件分布(a)及统计(b)示意图
Fig.4 Distribution of 1088 teleseismic events used in this study
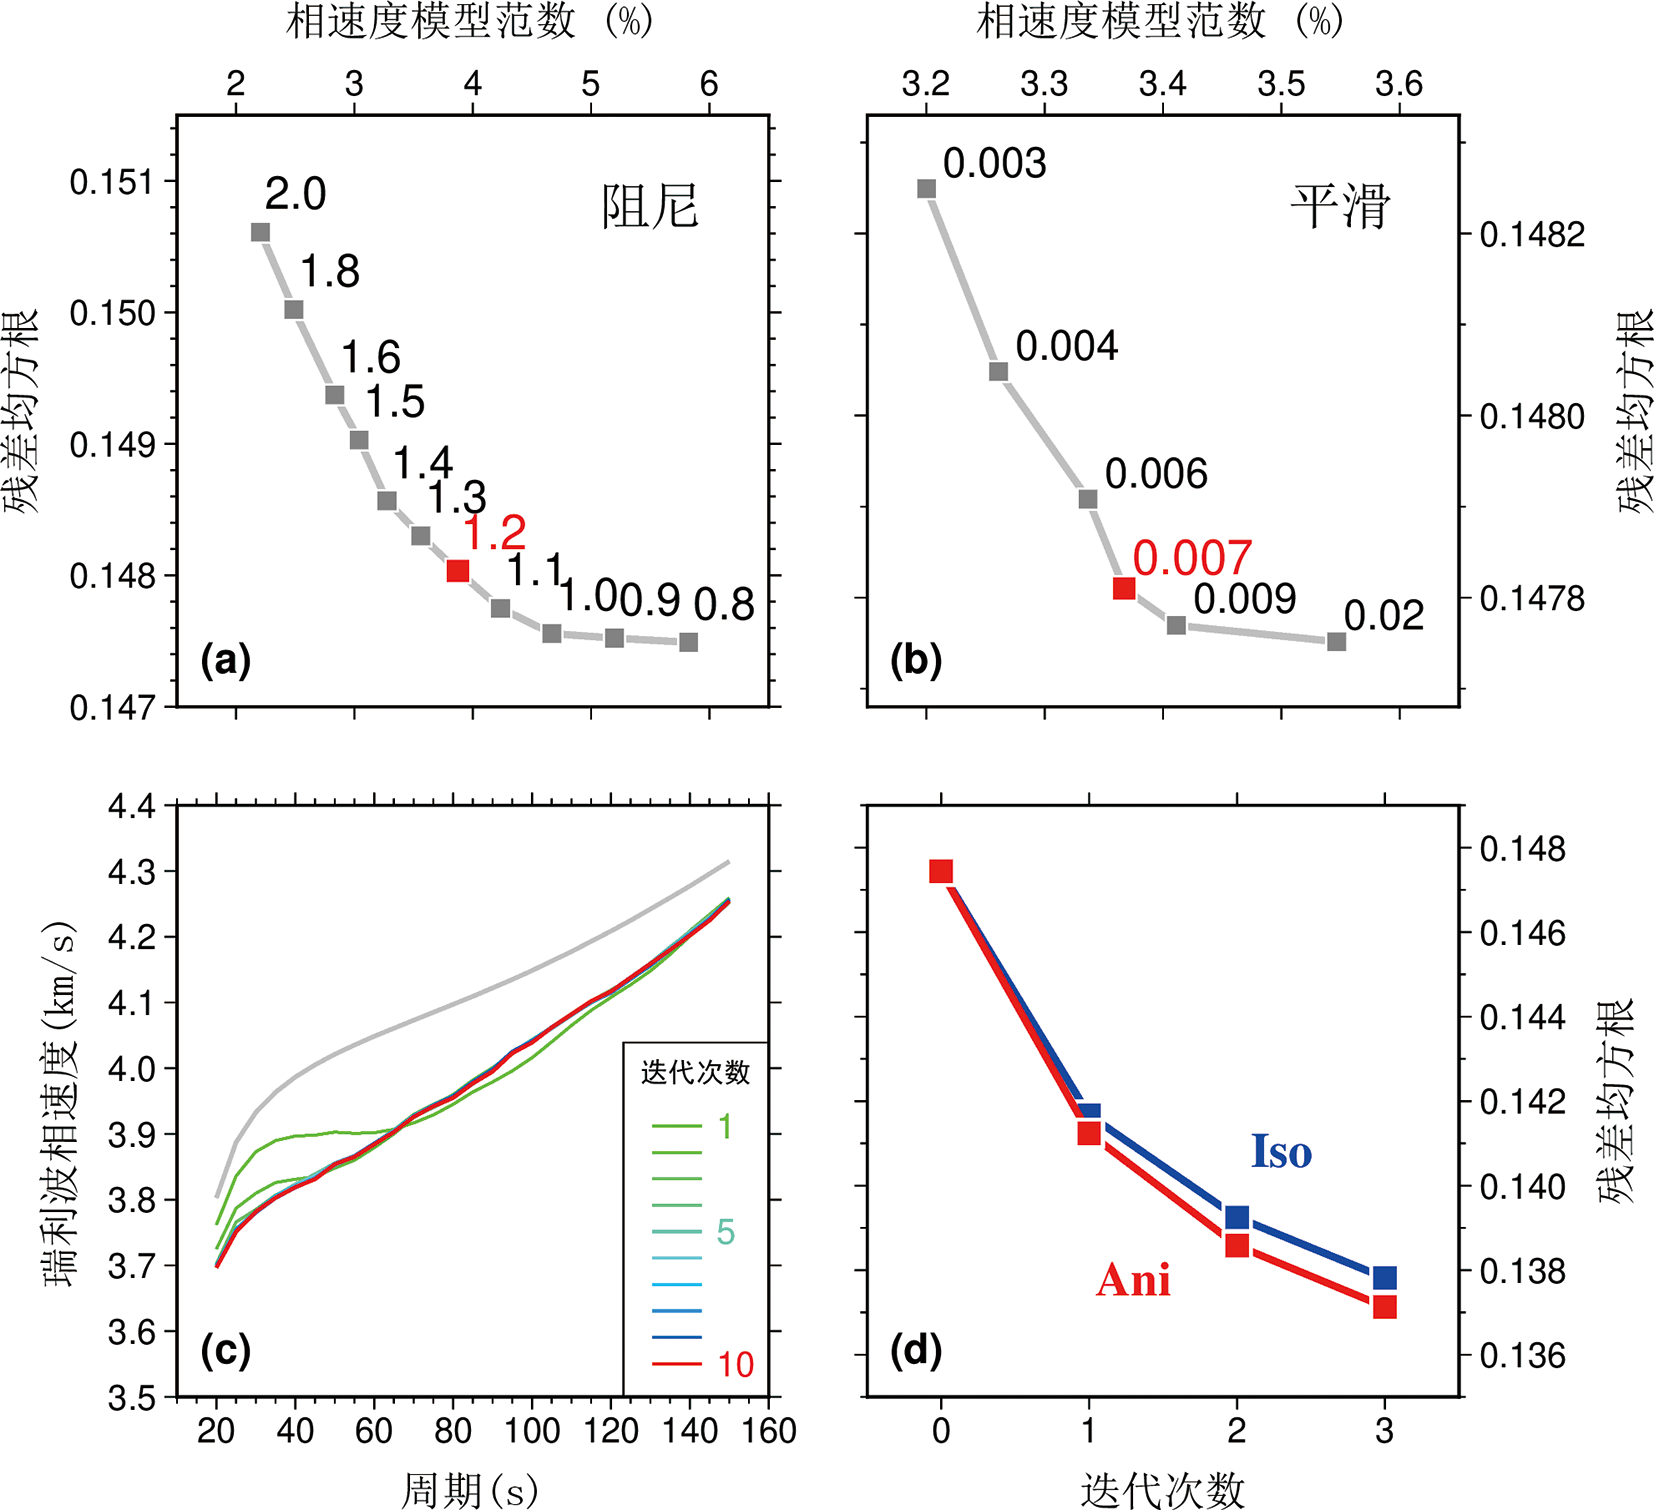
图5 瑞利波相速度层析成像相关参数 (a)阻尼折中曲线,红色数字表示本研究采用的阻尼系数;(b)平滑折中曲线,红色数字表示本研究采用的平滑系数;(c)平均相速度频散曲线迭代图,灰色线表示源自经修正的AK135模型的初始相速度频散曲线,红色线表示经十次迭代后的最佳一维频散曲线;(d)各向同性(Iso)和各向异性(Ani)反演前后残差的均方根变化图
Fig.5 Parameters of Rayleigh-wave phase velocity tomography

图6 剪切波速度层析反演前后残差分布图 (a)反演前后C0残差分布图,蓝色和红色分别表示反演前后,下同;(b)反演前后各向异性参数 ( A C c o s 2 φ + B C s i n 2 φ)残差分布图;(c)反演前后C0残差均方根变化图;(d)反演前后各向异性参数残差均方根变化图
Fig.6 Distributions of residuals after the Vs tomographic inversion
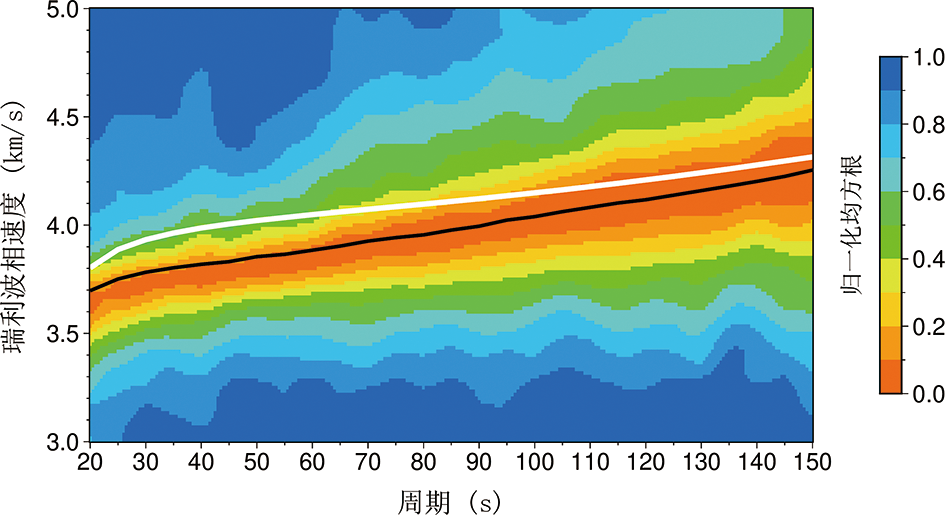
图7 最佳平均相速度频散曲线可靠性检验 黑线表示最佳平均相速度频散曲线;白线表示源自AK135模型的初始频散曲线
Fig.7 Reliability test of the optimal average phase-velocity dispersion curve
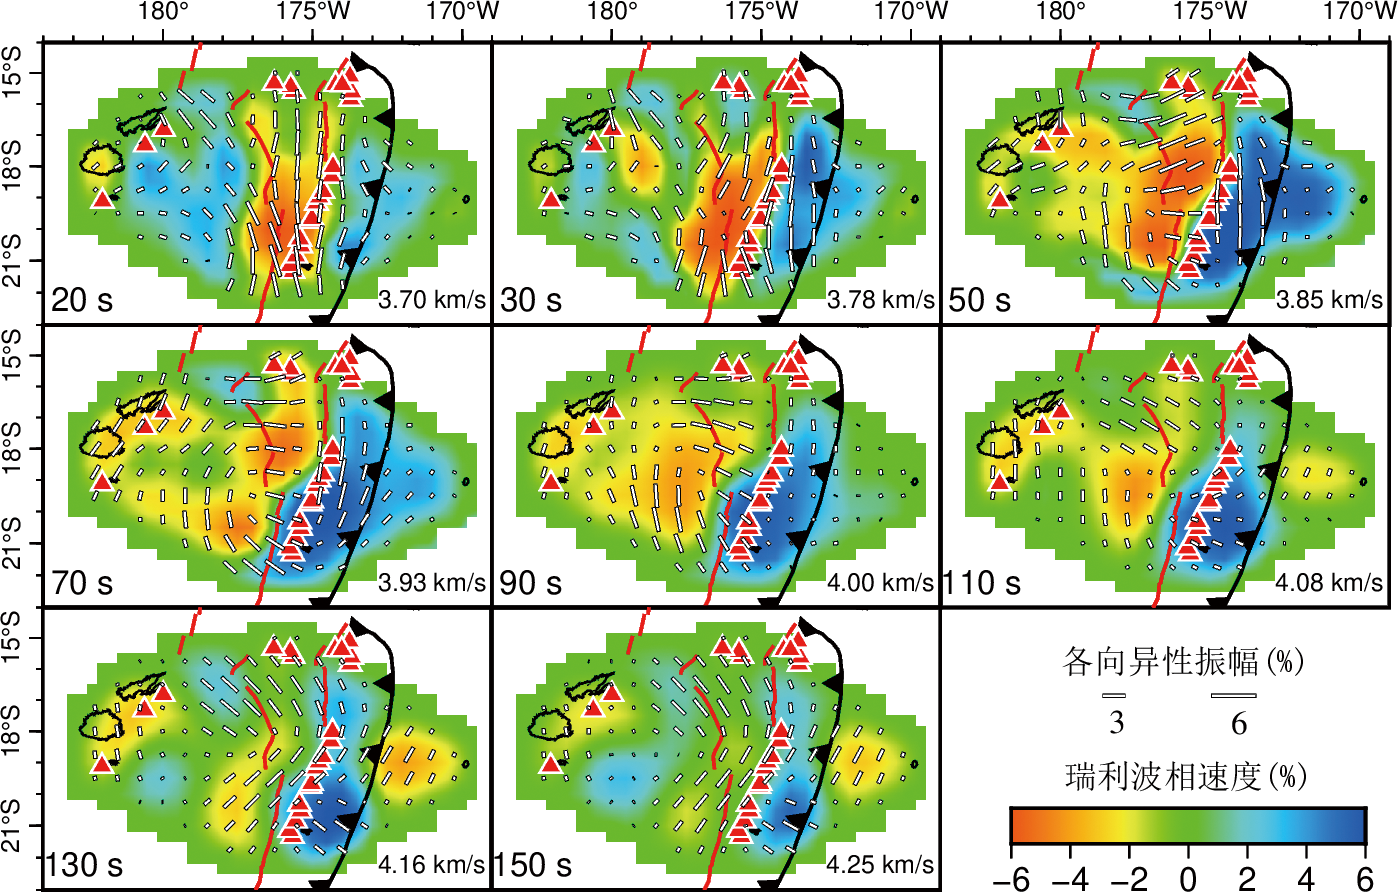
图8 瑞利波方位各向异性相速度层析成像的结果平面图 各子图右下角标注了对应周期的平均相速度;底图中红色和蓝色分别表示相对低和高的瑞利波各向同性相速度;白色短棒的方向指示快波方向,短棒的长短表示各向异性的振幅大小;其余图例与图1相同
Fig.8 Map views of Rayleigh-wave phase-velocity azimuthal anisotropy tomography
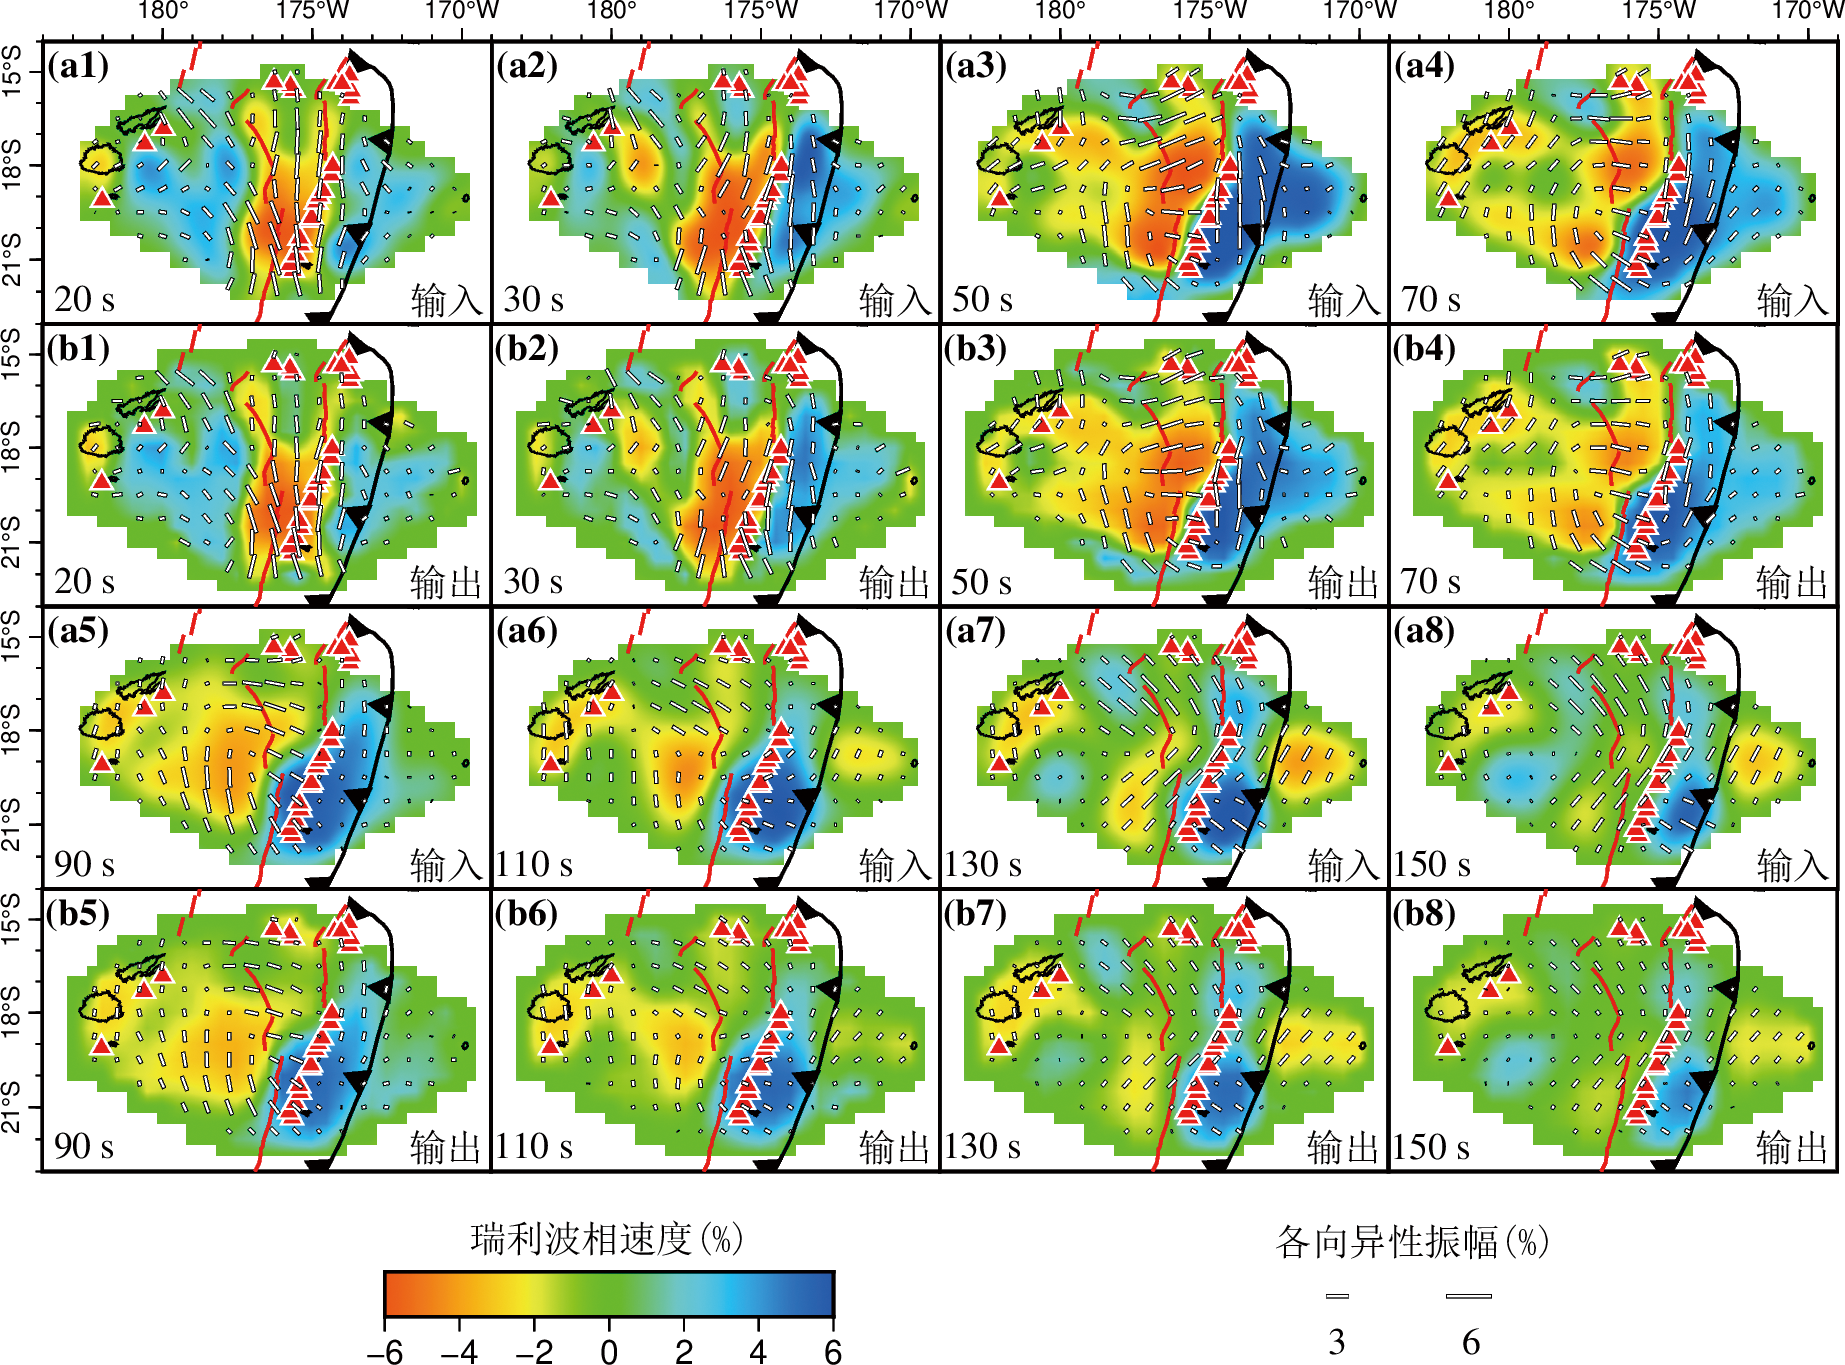
图9 瑞利波方位各向异性相速度层析成像的恢复分辨率测试 (a1)-(a8) 输入模型;(b1)-(b8) 输出模型;底图中红色和蓝色分别表示相对低和高的瑞利波各向同性相速度;白色短棒的方向指示相速度快波方向,短棒的长短表示各向异性的振幅大小;其余图例与图1相同
Fig.9 Restoring resolution test(RRT)for the Rayleigh-wave phase-velocity azimuthal anisotropy tomography

图10 剪切波方位各向异性速度层析成像的结果平面图 底图中红色和蓝色分别代表相对低和高的剪切波各向同性速度扰动;白色短棒的方向指示剪切波速度的快波方向,短棒的长短表示各向异性的振幅大小;紫色线表示对应深度的俯冲板片上表面位置;灰色锯齿线表示洋底年龄等时线;紫色剪头表示太平洋板块运动方向;各深度对应的平均剪切波速度标示在子图右下角
Fig.10 Map views of the Vs azimuthal anisotropy tomography

图11 剪切波方位各向异性速度层析成像的结果剖面图 剖面图横轴含义是距汤加海沟的距离,向东为正,向西为负,纵轴表示距地表深度;图中红色和蓝色分别代表相对低和高的剪切波各向同性速度扰动;红色线表示源自Slab 2模型[39]的俯冲板片上表面位置;白色圆圈表示剖面两侧25 km距离范围内的地震事件;黑色线表示源自CRUST 1.0模型的莫霍面位置;地形图上红色三角形、红色箭头和黑色倒三角分别表示活火山、弧后扩张中心和汤加海沟;剖面位置如右下角插图中蓝色线所示;插图中正方形代表本研究使用的地震台站,插图中的其他图例与图1相同
Fig.11 Vertical cross-sections of the Vs azimuthal anisotropy tomography

图12 剪切波方位各向异性速度层析成像的棋盘格分辨率测试结果平面图 (a1)-(a8) 输入模型;(b1)-(b8) 输出模型;图中红色和蓝色分别代表相对低和高的剪切波各向同性速度扰动;白色短棒的方向指示剪切波速度的快波方向,短棒的长短表示各向异性的振幅大小;其余图例与图1相同
Fig.12 Map views of a checkerboard resolution test (CRT) for the Vs azimuthal anisotropy tomography

图13 剪切波方位各向异性速度层析成像的棋盘格分辨率测试结果剖面图 图中均为输出模型,输入模型如图12所示;红色和蓝色分别代表了低和高的剪切波各向同性速度扰动;此图中的剖面位置与图11中的不同
Fig.13 Vertical cross-sections of a checkerboard resolution test (CRT) for the Vs azimuthal anisotropy tomography

图14 剪切波方位各向异性速度层析成像的恢复分辨率测试平面图 (a1)—(a8) 输入模型;(b1)—(b8) 输出模型;底图中红色和蓝色分别代表相对低和高的剪切波各向同性速度扰动;白色短棒的方向指示剪切波速度快波方向,短棒的长短表示各向异性的振幅大小;其余图例与图1相同
Fig.14 Map views of a restoring resolution test(RRT)for the Vs azimuthal anisotropy tomography

图15 汤加—劳—斐济地区上地幔构造特征示意图 NWLSC,西北劳扩张中心;LETZ, 劳伸展变形带;CLSC, 中劳扩张中心;ELSC, 东劳扩张中心;VFR,瓦鲁法脊;FRSC, 弗努阿雷裂谷和扩张中心
Fig.15 Schematic diagram of the upper mantle structure beneath the Tonga-Lau-Fiji region
| [1] | CHANG S J, FERREIRA A M G, FACCENDA M. Upper-and mid-mantle interaction between the Samoan plume and the Tonga-Kermadec slabs[J]. Nature Communications, 2016, 7: 10799. |
| [2] | SCHMID F, KOPP H, SCHNABEL M, et al. Crustal structure of the Niuafo’ou Microplate and Fonualei Rift and spreading center in the Northeastern Lau Basin, Southwestern Pacific[J]. Journal of Geophysical Research: Solid Earth, 2020, 125(6): e2019JB01918. |
| [3] | TAYLOR B, ZELLMER K, MARTINEZ F, et al. Sea-floor spreading in the Lau back-arc basin[J]. Earth and Planetary Science Letters, 1996, 144(1/2): 35-40. |
| [4] | ZHAO D P, XU Y B, WIENS D A, et al. Depth Extent of the Lau Back-Arc Spreading Center and Its Relation to Subduction Processes[J]. Science, 1997, 278: 254-257. |
| [5] | CONDER J A, WIENS D A. Seismic structure beneath the Tonga arc and Lau back-arc basin determined from joint Vp, Vp/Vs tomography[J]. Geochemistry, Geophysics, Geosystems, 2006, 7(3): Q03018. |
| [6] | MENKE W, ZHA Y, WEBB S C, et al. Seismic anisotropy indicates ridge-parallel asthenospheric flow beneath the Eastern Lau Spreading Center[J]. Journal of Geophysical Research: Solid Earth, 2015, 120(2): 976-992. |
| [7] | WEI S S, ZHA Y, SHEN W S, et al. Upper mantle structure of the Tonga-Lau-Fiji region from Rayleigh wave tomography[J]. Geochemistry, Geophysics, Geosystems, 2016, 17(11): 4705-4724. |
| [8] | WEI S S, WIENS D A. P-wave attenuation structure of the Lau back-arc basin and implications for mantle wedge processes[J]. Earth and Planetary Science Letters, 2018, 502: 187-199. |
| [9] | WEI S S, WIENS D A. High bulk and shear attenuation due to partial melt in the Tonga-Lau Back-arc Mantle[J]. Journal of Geophysical Research: Solid Earth, 2020, 125(1):e2019JB017527. |
| [10] | YU Z T, ZHAO D P, LI J B. Structure and dynamics of the Tonga subduction zone: New insight from P-wave anisotropic tomography[J]. Earth and Planetary Science Letters, 2022, 598: 117844. |
| [11] | FISCHER K M, WIENS D A. The depth distribution of mantle anisotropy beneath the Tonga subduction zone[J]. Earth and Planetary Science Letters, 1996, 142(1/2): 253-260. |
| [12] |
SMITH G P, WIENS D A, FISCHER K M, et al. A complex pattern of mantle flow in the Lau Backarc[J]. Science, 2001, 292: 713-716.
PMID |
| [13] | FOLEY B J, LONG M D. Upper and mid-mantle anisotropy beneath the Tonga slab[J]. Geophysical Research Letters, 2011, 38(2): L02303. |
| [14] | PEARCE J A, KEMPTON P D, GILL J B. Hf-Nd evidence for the origin and distribution of mantle domains in the SW Pacific[J]. Earth and Planetary Science Letters, 2007, 260(1/2): 98-114. |
| [15] | LYTLE M L, KELLEY K A, HAURI E H, et al. Tracing mantle sources and Samoan influence in the northwestern Lau back-arc basin[J]. Geochemistry Geophysics Geosystems, 2012, 13(10): Q10019. |
| [16] | PRICE A A, JACKSON M G, BLICHERT-TOFT J, et al. Evidence for a broadly distributed Samoan-plume signature in the northern Lau and North Fiji Basins[J]. Geochemistry, Geophysics, Geosystems, 2014, 15(4): 986-1008. |
| [17] | PRICE A A, JACKSON M G, BLICHERT-TOFT J, et al. Geochemical evidence in the northeast Lau Basin for subduction of the Cook-Austral volcanic chain in the Tonga Trench[J]. Geochemistry, Geophysics, Geosystems, 2016, 17(5): 1694-1724. |
| [18] | PRICE A A, JACKSON M G, BLICHERT-TOFT J, et al. Geodynamic implications for zonal and meridional isotopic patterns across the northern Lau and North Fiji Basins[J]. Geochemistry, Geophysics, Geosystems, 2017, 18(3): 1013-1042. |
| [19] | LIU X, ZHAO D. P and S wave tomography of Japan subduction zone from joint inversions of local and teleseismic travel times and surface-wave data[J]. Physics of the Earth and Planetary Interiors, 2016, 252: 1-22. |
| [20] | LIU X, ZHAO D P. Seismic evidence for a plume-modified oceanic lithosphere-asthenosphere system beneath Cape Verde[J]. Geophysical Journal International, 2021, 225(2): 872-886. |
| [21] | FORSYTH D W, LI A B. Array Analysis of Two-Dimensional Variations in Surface Wave Phase Velocity and Azimuthal Anisotropy in the Presence of Multipathing Interference[J]. American Geophysical Union Geophysical Monograph Series, 2005, 157: 81-97. |
| [22] | WANG J, ZHAO D P. Mapping P-wave anisotropy of the Honshu arc from Japan Trench to the back-arc[J]. Journal of Asian Earth Sciences, 2010, 39(5): 396-407. |
| [23] | PAIGE C C, SAUNDERS M A. LSQR, An algorithm for sparse linear equations and sparse least squares[J]. ACM Trans Math Software, 1982, 8(1),43-71. |
| [24] | KENNETT B L N, ENGDAHL E R, BULAND R. Constraints on seismic velocities in the Earth from traveltimes[J]. Geophysical Journal International, 1995, 122(1): 108-124. |
| [25] | LIU X, ZHAO D P. Backarc spreading and mantle wedge flow beneath the Japan Sea: insight from Rayleigh-wave anisotropic tomography[J]. Geophysical Journal International, 2016, 207(1): 357-373. |
| [26] | YANG Y J, FORSYTH D W. Regional tomographic inversion of the amplitude and phase of Rayleigh waves with 2-D sensitivity kernels[J]. Geophysical Journal International, 2006, 166(3): 1148-1160. |
| [27] | ZHAO D, HASEGAWA A, HORIUCHI S. Tomographic imaging of P and S wave velocity structure beneath northeastern Japan[J]. Journal of Geophysical Research: Solid Earth, 1992, 97(B13):19909-19928. |
| [28] | LIU X, ZHAO D P. Seismic velocity azimuthal anisotropy of the Japan subduction zone: Constraints from P and S wave traveltimes[J]. Journal of Geophysical Research: Solid Earth, 2016, 121(7): 5086-5115. |
| [29] | WANG J, ZHAO D P. P-wave tomography for 3-D radial and azimuthal anisotropy of Tohoku and Kyushu subduction zones[J]. Geophysical Journal International, 2013, 193(3): 1166-1181. |
| [30] | SALTO M. DISPER 80. A subroutine package for the calculation of seismic normal-mode Solutions[M]//DOORNBOS D J.Seismological Algorithms Computational Methods and Computer Programs. Academic Press, 1988: 293-319. |
| [31] | BIRCH F. The velocity of compressional waves in rocks to 10 kilobars: 2[J]. Journal of Geophysical Research, 1961, 66(7): 2199-2224. |
| [32] | ZHAO L, LIU X, ZHAO D P, et al. Mapping the Pacific Slab Edge and Toroidal Mantle Flow Beneath Kamchatka[J]. Journal of Geophysical Research: Solid Earth, 2021, 126(11): e2021JB022518. |
| [33] | WANG X, LIU X, ZHAO D P, et al. Oceanic plate subduction and continental extrusion in Sumatra: Insight from S-wave anisotropic tomography[J]. Earth and Planetary Science Letters, 2022, 580: 117388. |
| [34] | CUI H H, ZHOU Y Z, CHEN Y L. Seismic evidence of the lithosphere-asthenosphere boundary beneath the Tonga area, southwestern Pacific[J]. Journal of Asian Earth Sciences, 2017, 138: 129-135. |
| [35] | BUTTLES J, OLSON P. A laboratory model of subduction zone anisotropy[J]. Earth and Planetary Science Letters, 1998, 164(1/2): 245-262. |
| [36] | KINCAID C, GRIFFITHS R W. Laboratory models of the thermal evolution of the mantle during rollback subduction[J]. Nature, 2003, 425: 58-62. |
| [37] | MARTIN A K. Concave slab out board of the Tonga subduction zone caused by opposite toroidal flows under the North Fiji Basin[J]. Tectonophysics, 2014, 622: 56-61. |
| [38] | KARATO S-I, JUNG H, KATAYAMA I, et al. Geodynamic Significance of Seismic Anisotropy of the Upper Mantle: New Insights from Laboratory Studies[J]. Annual Review of Earth and Planetary Sciences, 2008, 36(1): 59-95. |
| [39] | 江国明, 张贵宾, 徐峣. 中国东北地区太平洋板块精细俯冲特征[J]. 现代地质, 2012, 26(6): 1125-1135. |
| [40] |
HAYES G P, MOORE G L, PORTNER D E, et al. Slab2, a comprehensive subduction zone geometry model[J]. Science, 2018, 362: 58-61.
DOI PMID |
| [41] | RANERO C R, MORGAN J P, MCINTOSH K, et al. Bending-related faulting and mantle serpentinization at the Middle America trench[J]. Nature, 2003, 425: 367-373. |
| [42] | FACCENDA M, BURLINI L, GERYA T V, et al. Fault-induced seismic anisotropy by hydration in subducting oceanic plates[J]. Nature, 2008, 455: 1097-1100. |
| [43] | MILLER N C, LIZARRALDE D. Finite-frequency wave propagation through outer rise fault zones and seismic measurements of upper mantle hydration[J]. Geophysical Research Letters, 2016, 43(15): 7982-7990. |
| [44] |
刘鑫, 李三忠, 赵淑娟, 等. 马里亚纳俯冲系统的构造特征[J]. 地学前缘, 2017, 24(4): 329-340.
DOI |
| [45] | CAI C, WIENS D A, SHEN W S, et al. Water input into the Mariana subduction zone estimated from ocean-bottom seismic data[J]. Nature, 2018, 563: 389-392. |
| [46] | WANG Z W, ZHAO D P, CHEN X F. Seismic Anisotropy and Intraslab Hydrated Faults Beneath the NE Japan Forearc[J]. Geophysical Research Letters, 2022, 49(2): e97266. |
| [47] | EBERHART-PHILLIPS D, REYNERS M. Three-dimensional distribution of seismic anisotropy in the Hikurangi subduction zone beneath the central North Island, New Zealand[J]. Journal of Geophysical Research: Solid Earth, 2009, 114(B6): B06301. |
| [48] | ZHOU Z Y, LIN J, BEHN M D, et al. Mechanism for normal faulting in the subducting plate at the Mariana Trench[J]. Geophysical Research Letters, 2015, 42(11): 4309-4317. |
| [49] | HUANG Z C, TILMANN F, COMTE D, et al. P wave azimuthal Anisotropic tomography in Northern Chile: Insight into deformation in the subduction zone[J]. Journal of Geophysical Research: Solid Earth, 2019, 124(1): 742-765. |
| [50] | WEI W, ZHAO D P, XU J D, et al. P and S wave tomography and anisotropy in Northwest Pacific and East Asia: Constraints on stagnant slab and intraplate volcanism[J]. Journal of Geophysical Research: Solid Earth, 2015, 120(3): 1642-1666. |
| [51] | RUSSELL J B, GAHERTY J B, LIN P Y P, et al. High-Resolution Constraints on Pacific Upper Mantle Petrofabric Inferred From Surface-Wave Anisotropy[J]. Journal of Geophysical Research: Solid Earth, 2019, 124(1): 631-657. |
| [52] | BONNARDOT M A, RÉGNIER M, CHRISTOVA C, et al. Seismological evidence for a slab detachment in the Tonga subduction zone[J]. Tectonophysics, 2009, 464(1/2/3/4): 84-99. |
| [53] | LONG M D, SILVER P G. The subduction zone flow field from seismic anisotropy: a global view[J]. Science, 2008,319: 315-318. |
| [54] | FACCENDA M, CAPITANIO F A. Seismic anisotropy around subduction zones: Insights from three-dimensional modeling of upper mantle deformation and SKS splitting calculations[J]. Geochemistry, Geophysics, Geosystems, 2013, 14(1): 243-262. |
| [55] | PACZKOWSKI K, THISSEN C J, LONG M D, et al. Deflection of mantle flow beneath subducting slabs and the origin of subslab anisotropy[J]. Geophysical Research Letters, 2014, 41(19): 6734-6742. |
| [56] | QIAO Q Y, LIU X, ZHAO D P, et al. Upper mantle structure beneath Mariana: Insights from Rayleigh-wave anisotropic tomography[J]. Geochemistry, Geophysics, Geosystems, 2021, 22(11): e2021GC009902. |
| [57] | ZHAO D, LIU X, ZHAO D P, et al. Subduction-driven mantle flow beneath active back-arc basins inferred from seismic anisotropy tomography[J]. Earth and Planetary Science Letters, 2024, 643: 118890. |
| [58] | WESSEL P, SMITH W H F. New, improved version of generic mapping tools released[J]. Eos, Transactions American Geophysical Union, 2006, 79: 579-579. |
| [59] | GOLDSTEIN P, DODGE D, FIRPO M, et al. SAC2000: Signal processing and analysis tools for seismologists and engineers[J]. International Geophysics. Amsterdam: Elsevier, 2003: 1613-1614. |
| [60] | CROTWELL H P, OWENS T J, RITSEMA J. The TauP toolkit: flexible seismic travel-time and ray-path utilities[J]. Seismological Research Letters, 1999, 70(2): 154-160. |
| No related articles found! |
| 阅读次数 | ||||||
|
全文 |
|
|||||
|
摘要 |
|
|||||