

现代地质 ›› 2024, Vol. 38 ›› Issue (03): 612-623.DOI: 10.19657/j.geoscience.1000-8527.2024.026
姚瑞晨1( ), 郝仕龙1(), 李秀萍1, 侯佳成1, 陈浩源1, 张岩2
出版日期:2024-06-10
发布日期:2024-07-05
通讯作者:
郝仕龙,男,教授, 1972年出生,主要从事水土资源与遥感技术应用研究。Email: haoshilong@ncwu.edu.cn。
作者简介:姚瑞晨,男,硕士研究生,1996年出生,主要从事水土保持研究。Email:yaoruichen0327@163.com。
YAO Ruichen1(), HAO Shilong1(), LI Xiuping1, HOU Jiacheng1, CHEN Haoyuan1, ZHANG Yan2
Online:2024-06-10
Published:2024-07-05
摘要:
基于GIMMS NDVI3g和MODIS NDVI数据,利用一元线性回归模型,本文构建了1982—2020年黄河流域(河南段)GIMMS-MODIS NDVI数据集;在此基础上,结合Sen趋势、Mann-Kendall(M-K)及偏相关分析等方法探究了黄河流域(河南段)NDVI时空演变及其对气候因子的响应。结果表明:(1)重构的GIMMS MODIS NDVI和GIMMS NDVI拟合效果较好,其R2达到了0.8799(P<0.01),二者的月均值直方图差值在[-0.02,0.02]之间的占比高达81.47%;(2)1982—2020年黄河流域(河南段)年和春、夏、秋、冬四季NDVI值均呈现波动增加的趋势,其增加速率分别为0.0018 a-1(P<0.01)、0.0027 a-1(P<0.01)、0.0006 a-1(P<0.1)、0.0013 a-1(P<0.01)和0.0024 a-1(P<0.01);空间上,该流域年和春、夏、秋、冬四季NDVI显著增加的面积占比分别为76.62%、76.62%、33.64%、57.19%和77.16%,显著下降的区域主要位于流域中南部地区;(3)1982—2020年黄河流域(河南段)年均气温呈现显著增加的趋势(slope=0.0377 ℃·a-1,P<0.01)。从季节变化来看,春季和秋季的平均气温增加速率最快,降水的变化在年及其春、夏、秋、冬四季变化均不显著;(4)1982—2020年黄河流域(河南段)年、春季及其冬季NDVI变化主要受到气温控制,夏季NDVI变化主要受降水影响;从空间分布来看,年、春季和冬季NDVI与气温呈显著相关的站点比例分别为82.14%、50%和75%,春季、夏季和秋季NDVI与降水呈显著正相关的站点比例分别为3.57%、14.29%和3.57%,主要零星分布在流域的中部地区。
中图分类号:
姚瑞晨, 郝仕龙, 李秀萍, 侯佳成, 陈浩源, 张岩. 1982—2020年黄河流域(河南段)NDVI动态演变及其与气候变化响应研究[J]. 现代地质, 2024, 38(03): 612-623.
YAO Ruichen, HAO Shilong, LI Xiuping, HOU Jiacheng, CHEN Haoyuan, ZHANG Yan. Dynamic Evolution of the Vegetation and Its Response to Climate Changes from 1982 to 2020 in the Yellow River Basin (Henan Section)[J]. Geoscience, 2024, 38(03): 612-623.
| 年份 | 土地类型 | 耕地 | 林地 | 草地 | 水体 | 建设 用地 | 未利 用地 |
|---|---|---|---|---|---|---|---|
| 2000 | 类型面积(km2) | 22065 | 8219 | 4080 | 1533 | 2907 | 117 |
| 类型比例(%) | 56.69 | 21.12 | 10.48 | 3.94 | 7.47 | 0.30 | |
| 2020 | 类型面积(km2) | 21177 | 8208 | 3540 | 1344 | 4908 | 13 |
| 类型比例(%) | 54.04 | 20.94 | 9.03 | 3.43 | 12.52 | 0.03 |
表1 2000年和2020年黄河流域(河南段)土地利用类型分布状况
Table 1 Distribution of land use types in the Yellow River Basin (Henan section) in 2000 and 2020
| 年份 | 土地类型 | 耕地 | 林地 | 草地 | 水体 | 建设 用地 | 未利 用地 |
|---|---|---|---|---|---|---|---|
| 2000 | 类型面积(km2) | 22065 | 8219 | 4080 | 1533 | 2907 | 117 |
| 类型比例(%) | 56.69 | 21.12 | 10.48 | 3.94 | 7.47 | 0.30 | |
| 2020 | 类型面积(km2) | 21177 | 8208 | 3540 | 1344 | 4908 | 13 |
| 类型比例(%) | 54.04 | 20.94 | 9.03 | 3.43 | 12.52 | 0.03 |

图1 黄河流域(河南段)研究区土地利用概况
Fig.1 Land use in the study area of the Yellow River Basin (Henan Section)
| 参数 | 数据来源 | 空间分辨 率(km) | 时间分辨 率(d) | 数据名称 |
|---|---|---|---|---|
| NDVI | GIMMS NDVI | 8 | 15 | 美国国家航空航天局 |
| MODIS NDVI | 1 | 30 | 美国国家航空航天局 | |
| 气象 数据 | 气温 | — | 1 | 中国气象数据网 |
| 降水 | — | 1 | 中国气象数据网 | |
| 辅助 数据 | 土地利用 | 1 | 1 | 资源环境科学与数据 中心 |
表2 气象和土地利用数据资料表
Table 2 Data profile of meteorology and land use
| 参数 | 数据来源 | 空间分辨 率(km) | 时间分辨 率(d) | 数据名称 |
|---|---|---|---|---|
| NDVI | GIMMS NDVI | 8 | 15 | 美国国家航空航天局 |
| MODIS NDVI | 1 | 30 | 美国国家航空航天局 | |
| 气象 数据 | 气温 | — | 1 | 中国气象数据网 |
| 降水 | — | 1 | 中国气象数据网 | |
| 辅助 数据 | 土地利用 | 1 | 1 | 资源环境科学与数据 中心 |

图2 2001—2015年黄河流域(河南段)逐月(a)及月均值(b)GIMMS NDVI和MODIS NDVI变化
Fig.2 Monthly (a) and multi-year monthly average (b) changes of GIMMS NDVI and MODIS NDVI in the Yellow River Basin (Henan section) from 2001 to 2015
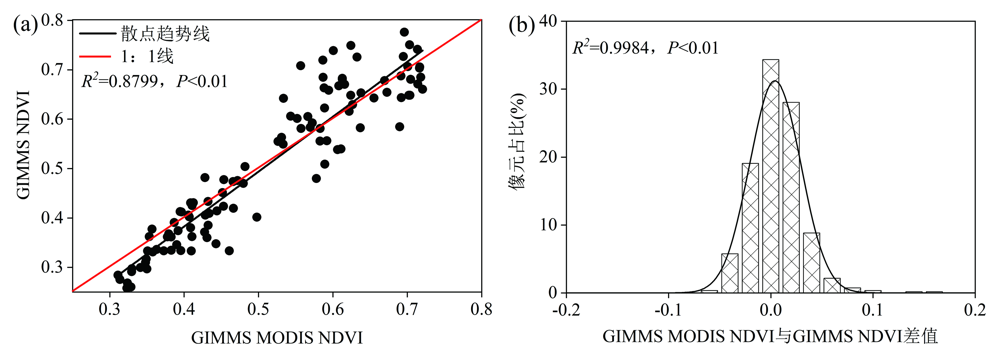
图3 重构前后 GIMMS NDVI和GIMMS MODIS NDVI散点图(a)及差值直方图(b)
Fig.3 Scatterplot (a) and difference histogram (b) of GIMMS NDVI and GIMMS MODIS NDVI before and after the reconstruction

图4 1982—2020年黄河流域(河南段)年均(a)和季节(b)NDVI时间变化趋势
Fig.4 Time variation trend of annual average (a) and seasonal (b) NDVI in the Yellow River Basin (Henan section) from 1982 to 2020

图5 1982—2020年黄河流域(河南段)年均NDVI变化趋势(a)和显著性(b)空间分布
Fig.5 Annual NDVI trend (a) and significance (b) spatial distribution in the Yellow River Basin (Henan section) from 1982 to 2020

图6 1982—2020年黄河流域(河南段)春、夏、秋和冬季NDVI变化趋势及显著性空间分布格局
Fig.6 NDVI trend and spatial pattern of significance in spring, summer, autumn, and winter of the Yellow River Basin (Henan section) from 1982 to 2020
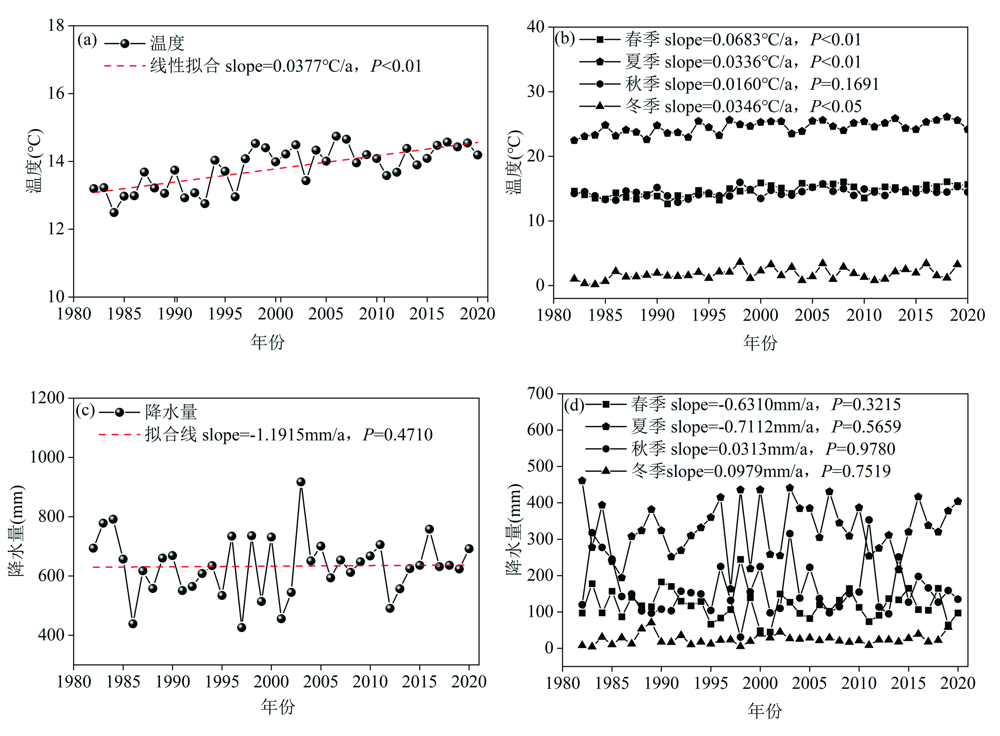
图7 1982—2020年黄河流域(河南段)年均及四季气温和降水量时间变化趋势
Fig.7 Temporal variation trends of annual and seasonal temperature and precipitation in the Yellow River Basin (Henan section) from 1982 to 2020
| 参数 | 年 | 春季 | 夏季 | 秋季 | 冬季 |
|---|---|---|---|---|---|
| NDVI-气温 | 0.6340** | 0.5912** | 0.1631 | 0.0557 | 0.4961** |
| NDVI-降水 | 0.0122 | 0.2372 | 0.2443 | -0.0177 | 0.0660 |
表3 1982—2020年黄河流域(河南段)年、春、夏、秋、冬NDVI与降水和气温的偏相关系数
Table 3 Partial correlation coefficients between NDVI and precipitation and temperature in interannual, spring, summer, autumn, and winter in the Yellow River Basin (Henan section) from 1982 to 2020
| 参数 | 年 | 春季 | 夏季 | 秋季 | 冬季 |
|---|---|---|---|---|---|
| NDVI-气温 | 0.6340** | 0.5912** | 0.1631 | 0.0557 | 0.4961** |
| NDVI-降水 | 0.0122 | 0.2372 | 0.2443 | -0.0177 | 0.0660 |

图8 1982—2020年黄河流域(河南段)年际(a)、春(b)、夏(c)、秋(d)、冬(e)季气温变化空间分布
Fig.8 Spatial distribution of annual (a), spring (b), summer (c), autumn (d) and winter (e) temperature changes in the Yellow River Basin (Henan section) from 1982 to 2020

图9 1982—2020年黄河流域(河南段)年际(a)、春(b)、夏(c)、秋(d)、冬(e)季降水变化空间分布
Fig.9 Spatial distribution of annual(a), spring (b), summer (c), autumn (d) and winter (e) precipitation changes in the Yellow River Basin (Henan section) from 1982 to 2020
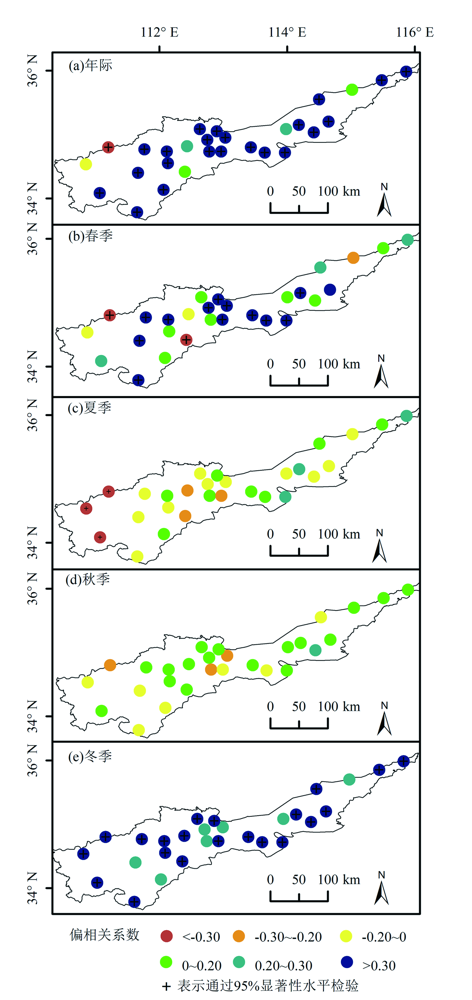
图10 1982—2022 年黄河流域(河南段)年际(a), 春(b), 夏、秋(d)、冬(e) NDVI与气温的偏相关系数空间分布
Fig.10 Spatial distribution of partial correlation coefficients between NDVI and temperature in interannual (a), spring (b), summer (c), autumn (d) and winter (e) in the Yellow River Basin (Henan section) from 1982 to 2022

图11 1982—2022 年黄河流域(河南段)年际(a)、春(b)、夏(c)、秋(d)、冬(e)NDVI与降水的偏相关系数空间分布
Fig.11 Spatial distribution of partial correlation coefficients between NDVI and precipitation in interannual(a), spring (b), summer (c), autumn (d) and winter (e) in the Yellow River Basin (Henan section) from 1982 to 2022
| 参数 | 耕地 | 林地 | 草地 | 建设用地 |
|---|---|---|---|---|
| NDVI趋势 | 0.0027 | 0.0035 | 0.0029 | 0.0016 |
| NDVI显著性 | P<0.1 | P<0.01 | P<0.05 | P>0.1 |
表4 不同植被类型的NDVI变化趋势
Table 4 NDVI variation of different vegetation types
| 参数 | 耕地 | 林地 | 草地 | 建设用地 |
|---|---|---|---|---|
| NDVI趋势 | 0.0027 | 0.0035 | 0.0029 | 0.0016 |
| NDVI显著性 | P<0.1 | P<0.01 | P<0.05 | P>0.1 |
| [1] |
孙高鹏, 刘宪锋, 王小红, 等. 2001—2020年黄河流域植被覆盖变化及其影响因素[J]. 中国沙漠, 2021, 41(4): 205-212.
DOI |
| [2] |
王晓蕾, 石守海. 基于GEE的黄河流域植被时空变化及其地形效应研究[J]. 地球信息科学学报, 2022, 24(6): 1087-1098.
DOI |
| [3] |
LAVERGNE A, GRAVEN H, DE KAUWE M G, et al. Observed and modelled historical trends in the water-use efficiency of plants and ecosystems[J]. Global Change Biology, 2019, 25(7): 2242-2257.
DOI PMID |
| [4] | 金晓媚, 万力, 薛忠歧, 等. 宁夏地区水资源对植被生长的影响研究[J]. 现代地质, 2007, 21(4): 632-637. |
| [5] |
马炳鑫, 和彩霞, 靖娟利, 等. 1982—2019年中国西南地区植被变化归因研究[J]. 地理学报, 2023, 78(3): 714-728.
DOI |
| [6] | PIAO S L, WANG X H, PARK T, et al. Characteristics, drivers and feedbacks of global greening[J]. Nature Reviews Earth & Environment, 2020, 1: 14-27. |
| [7] |
赵安周, 张安兵, 刘海新, 等. 退耕还林(草)工程实施前后黄土高原植被覆盖时空变化分析[J]. 自然资源学报, 2017, 32(3): 449-460.
DOI |
| [8] | LIU C X, ZHANG X D, WANG T, et al. Detection of vegetation coverage changes in the Yellow River Basin from 2003 to 2020[J]. Ecological Indicators, 2022, 138: 108818. |
| [9] |
LIU X F, SUN G P, FU Z, et al. Compound droughts slow down the greening of the Earth[J]. Global Change Biology, 2023, 29(11): 3072-3084.
DOI PMID |
| [10] | TYE M R, DAGON K, MOLINA M J, et al. Indices of extremes: Geographic patterns of change in extremes and associated vegetation impacts under climate intervention[J]. Earth System Dynamics, 2022, 13(3): 1233-1257. |
| [11] | 牛海鹏, 赵晓鸣, 肖东洋, 等. 黄河流域(河南段)耕地多功能时空格局演变及其权衡协同关系[J]. 农业工程学报, 2022, 38(23): 223-236. |
| [12] | LIU Y Q, LONG H L, LI T T, et al. Land use transitions and their effects on water environment in Huang-Huai-Hai Plain, China[J]. Land Use Policy, 2015, 47: 293-301. |
| [13] |
CHEN C, PARK T, WANG X H, et al. China and India lead in greening of the world through land-use management[J]. Nature Sustainability, 2019, 2(2): 122-129.
DOI PMID |
| [14] |
贺洁, 何亮, 吕渡, 等. 2001—2020年黄土高原光合植被时空变化及其驱动机制[J]. 植物生态学报, 2023, 47(3): 306-318.
DOI |
| [15] |
赵安周, 田新乐. 基于GEE平台的1986—2021年黄土高原植被覆盖度时空演变及影响因素[J]. 生态环境学报, 2022, 31(11): 2124-2133.
DOI |
| [16] | 陈春波, 李刚勇. 1981—2020年昆仑山—阿尔金山草地NDVI时空变化及其对气温、降水的响应[J]. 中国草地学报, 2023, 45(2): 13-25. |
| [17] | WANG Y X, CHEN T T, WANG Q, et al. Time-lagged and cumulative effects of drought and anthropogenic activities on China’s vegetation greening from 1990 to 2018[J]. International Journal of Digital Earth, 2023, 16(1): 2233-2258. |
| [18] | HIGGINS S I, CONRADI T, MUHOKO E. Shifts in vegetation activity of terrestrial ecosystems attributable to climate trends[J]. Nature Geoscience, 2023, 16(2): 147-153. |
| [19] | 刘海, 刘凤, 郑粮. 气候变化及人类活动对黄河流域植被覆盖变化的影响[J]. 水土保持学报, 2021, 35(4): 143-151. |
| [20] | FAN D L. Research on the establishment of NDVI long-term data set based on a novel method[J]. Scie.pngic Reports, 2023, 13: 9838. |
| [21] | 田智慧, 任祖光, 魏海涛. 2000—2020年黄河流域植被时空演化驱动机制[J]. 环境科学, 2022, 43(2): 743-751. |
| [22] | JIANG W X, NIU Z G, WANG L C, et al. Impacts of drought and climatic factors on vegetation dynamics in the Yellow River Basin and Yangtze River Basin, China[J]. Remote Sensing, 2022, 14(4): 930. |
| [23] | WANG X L, SHI S H, ZHAO X, et al. Detecting spatially non-stationary between vegetation and related factors in the Yellow River Basin from 1986 to 2021 using multiscale geographically weighted regression based onlandsat[J]. Remote Sensing, 2022, 14(24): 6276. |
| [24] | 郭永强, 王乃江, 褚晓升, 等. 基于Google Earth Engine分析黄土高原植被覆盖变化及原因[J]. 中国环境科学, 2019, 39(11): 4804-4811. |
| [25] | 肖东洋, 牛海鹏, 闫弘轩, 等. 1990—2018年黄河流域(河南段)土地利用格局时空演变[J]. 农业工程学报, 2020, 36(15): 271-281, 326. |
| [26] | 王琳, 李娜, 文广超, 等. 黄河流域河南段植被覆盖度变化及其驱动力[J]. 水土保持通报, 2022, 42(6): 393-399. |
| [27] | 任芝花, 余予, 邹凤玲, 等. 部分地面要素历史基础气象资料质量检测[J]. 应用气象学报, 2012, 23(6): 739-747. |
| [28] | 肖晶晶, 李正泉, 郭芬芬, 等. 浙江省1901—2017年降水序列构建及变化特征分析[J]. 气候变化研究进展, 2018, 14(6): 553-561. |
| [29] |
张鹏骞, 胡理乐, 白加德. 京津冀地区近20年NDVI时空变化特征[J]. 生态环境学报, 2021, 30(1): 29-36.
DOI |
| [30] | SEN P K. Estimates of the regression coefficient based on Kendall’s Tau[J]. Journal of the American Statistical Association, 1968, 63: 1379-1389. |
| [31] | KENDALL M G, GIBBONS J D. Rank Correlation Methods[M]. 5thedi. London: Edward Arnold, 1981: 320. |
| [32] | 郝爱华, 薛娴, 段翰晨, 等. 青藏高原典型草地NDVI时空演变的季节差异及其气候驱动[J]. 生态学报, 2023, 43(1): 352-363. |
| [33] |
谢舒笛, 莫兴国, 胡实, 等. 三北防护林工程区植被绿度对温度和降水的响应[J]. 地理研究, 2020, 39(1): 152-165.
DOI |
| [34] | 刘海, 黄跃飞, 郑粮, 等. 长时序丹江口水源区NDVI数据集构建及其时空动态变化分析[J]. 长江流域资源与环境, 2020, 29(8): 1780-1789. |
| [35] | 范松克, 郝成元. 2001—2016年河南省NDVI时空变化特征分析[J]. 江苏农业学报, 2019, 35(4): 860-867. |
| [36] |
余玉洋, 宋丰艺, 张世杰. 2000—2020年河南省NDVI时空变化及其驱动因素定量分析[J]. 生态环境学报, 2022, 31(10): 1939-1950.
DOI |
| [37] |
张静, 杜加强, 盛芝露, 等. 1982—2015年黄河流域植被NDVI时空变化及影响因素分析[J]. 生态环境学报, 2021, 30(5): 929-937.
DOI |
| [38] | QIAN C, SHAO L Q, HOU X H, et al. Detection and attribution of vegetation greening trend across distinct local landscapes under China’s Grain to Green Program: A case study in Shaanxi Province[J]. Catena, 2019, 183: 104182. |
| [39] | LI S S, YANG S N, LIU X F, et al. NDVI-based analysis on the influence of climate change and human activities on vegetation restoration in the Shaanxi-Gansu-Ningxia region, central China[J]. Remote Sensing, 2015, 7(9): 11163-11182. |
| [40] | 张绪财, 金晓媚, 朱晓倩, 等. 格尔木河流域植被指数时空分布及其影响因素研究[J]. 现代地质, 2019, 33(2): 461-468. |
| [41] | 王倩, 金晓媚, 张绪财, 等. 河北省张承地区2001—2020年植被动态变化及驱动因素分析[J]. 现代地质, 2023, 37(4): 881-891. |
| [1] | 周雪妮, 巴仁基, 肖成志, 曹亚廷, 计扬. 基于地质建造的岷江上游干旱河谷区下段土壤特征和植被时空变化[J]. 现代地质, 2024, 38(03): 660-673. |
| [2] | 王倩, 金晓媚, 张绪财, 殷秀兰, 金爱芳, 罗绪富. 河北省张承地区2001—2020年植被动态变化及驱动因素分析[J]. 现代地质, 2023, 37(04): 881-891. |
| [3] | 安国英, 郭兆成, 叶佩. 云南大理地区1989—2019年期间气候变化及对洱海水质的影响[J]. 现代地质, 2022, 36(02): 406-417. |
| [4] | 王香莲, 黄庭, 肖河, 吴代赦, 张小龙, 程胜高, 毛绪美. 东北哈尼泥炭沉积物磁化率特征及古气候意义[J]. 现代地质, 2021, 35(05): 1323-1331. |
| [5] | 许可可, 杨振京, 宁凯, 韩强强, 毕志伟, 赵楠楠. 基于端元法的银川盆地MIS6—MIS5气候变化探究[J]. 现代地质, 2021, 35(05): 1311-1322. |
| [6] | 路晶芳, 张克信, 宋博文, 徐亚东, 张楗钰, 黄威, 张道来. 柴达木盆地大红沟地区始新世—上新世孢粉记录及气候变化[J]. 现代地质, 2020, 34(04): 732-744. |
| [7] | 张绪财, 金晓媚, 朱晓倩, 张京. 格尔木河流域植被指数时空分布及其影响因素研究[J]. 现代地质, 2019, 33(02): 461-468. |
| [8] | 王建勇,张绪教,何泽新,赵秋晨,何祥丽,盛余应. 黄土高原北缘中部末次冰期冰楔假型的发现及意义[J]. 现代地质, 2015, 29(4): 816-824. |
| [9] | 赵俊香, 于慎谔, 刘智荣. 山西应县护驾岗冲沟阶地地层粒度特征与沉积环境[J]. 现代地质, 2012, 26(4): 716-722. |
| [10] | 陈曦, 王成善, 黄永建. 白垩纪快速气候变化研究新进展——温室世界中的冰川证据[J]. 现代地质, 2011, 25(3): 409-418. |
| [11] | 金晓媚 胡光成 史晓杰. 银川平原土壤盐渍化与植被发育和地下水埋深关系[J]. 现代地质, 2009, 23(1): 23-27. |
| [12] | 孙宪春,金晓媚,万力. 地下水对银川平原植被生长的影响[J]. 现代地质, 2008, 22(2): 321-324. |
| [13] | 金晓媚,万力, 薛忠歧, 张雷. 宁夏地区水资源对植被生长的影响研究[J]. 现代地质, 2007, 21(4): 632-637. |
| [14] | 赵海滨 尹志刚 万晓樵 于庆文 牛延宏. 据孢粉分析黑龙江嘉荫地区晚白垩世气候变化对恐龙绝灭的影响[J]. 现代地质, 2006, 20(2): 216-224. |
| 阅读次数 | ||||||
|
全文 |
|
|||||
|
摘要 |
|
|||||