

Geoscience ›› 2025, Vol. 39 ›› Issue (02): 478-494.DOI: 10.19657/j.geoscience.1000-8527.2025.025
• Monitoring, Modeling and Assessment of Supergene Resources • Previous Articles Next Articles
XIAO Yuexin1,2,3,4( ), SUN Zelong1,3(), MIN Yingzi1,3, YANG Pengzhi1,3, TIAN Zhaofei1,3, CHENG Ming1, LAN Jianmei2
Online:2025-04-10
Published:2025-05-08
Contact:
SUN Zelong
CLC Number:
XIAO Yuexin, SUN Zelong, MIN Yingzi, YANG Pengzhi, TIAN Zhaofei, CHENG Ming, LAN Jianmei. Spatiotemporal Dynamics and Drivers of Soil Erosion in the Mountainous Areas of South Anhui from 1990 to 2020[J]. Geoscience, 2025, 39(02): 478-494.

Fig.1 Relative location and administrative division map of the study area
| 数据 | 精度 | 来源 |
|---|---|---|
| 中国1 km分辨率逐月降水量数据集 | 1 km | 国家科技基础条件平台—国家地球系统科学数据中心( |
| 土壤质地数据 | 1:100万 | 国家冰川冻土沙漠科学数据中心( |
| 土地利用数据 | 30 m | 地球大数据科学工程数据共享服务系统( |
| NDVI数据集 | 1 km | 中国年度植被指数(NDVI)空间分布数据集,资源环境科学数据注册与出版系统( |
| DEM数据 | 30 m | 地理空间数据云( |
Table 1 Basic data and their resources
| 数据 | 精度 | 来源 |
|---|---|---|
| 中国1 km分辨率逐月降水量数据集 | 1 km | 国家科技基础条件平台—国家地球系统科学数据中心( |
| 土壤质地数据 | 1:100万 | 国家冰川冻土沙漠科学数据中心( |
| 土地利用数据 | 30 m | 地球大数据科学工程数据共享服务系统( |
| NDVI数据集 | 1 km | 中国年度植被指数(NDVI)空间分布数据集,资源环境科学数据注册与出版系统( |
| DEM数据 | 30 m | 地理空间数据云( |

Fig.2 R factor distribution in the mountainous area of south Anhui from 1990 to 2020
| 年份 | 最大值 (MJ·mm/km-2· h-1·a-1) | 最小值 (MJ·mm/km-2· h-1·a-1) | 平均值 (MJ·mm/km-2· h-1·a-1) |
|---|---|---|---|
| 1990 | 6934.83 | 3995.52 | 4408.07 |
| 2000 | 6065.20 | 2727.08 | 3856.50 |
| 2010 | 8568.40 | 3392.03 | 5150.20 |
| 2020 | 8024.08 | 3899.79 | 5162.78 |
Table 2 Statistics of rainfall erosivity factors in the mountainous area of south Anhui from 1990 to 2020
| 年份 | 最大值 (MJ·mm/km-2· h-1·a-1) | 最小值 (MJ·mm/km-2· h-1·a-1) | 平均值 (MJ·mm/km-2· h-1·a-1) |
|---|---|---|---|
| 1990 | 6934.83 | 3995.52 | 4408.07 |
| 2000 | 6065.20 | 2727.08 | 3856.50 |
| 2010 | 8568.40 | 3392.03 | 5150.20 |
| 2020 | 8024.08 | 3899.79 | 5162.78 |

Fig.3 K factor distribution in the mountainous area of south Anhui

Fig.4 LS factor distribution in the mountainous area of south Anhui
| 土地利 用类型 (LUCC) | 植被盖度 (FVC,%) | B值 | 土地利 用类型 (LUCC) | 植被盖度 (FVC,%) | B值 |
|---|---|---|---|---|---|
| 林地 | 0~20 | 0.100 | 草地 | 0~20 | 0.450 |
| 20~40 | 0.080 | 20~40 | 0.240 | ||
| 40~60 | 0.060 | 40~60 | 0.150 | ||
| 60~80 | 0.020 | 60~80 | 0.090 | ||
| 80~100 | 0.004 | 80~100 | 0.043 | ||
| 水域 | - | 0 | 平耕地 | - | 0.230 |
| 建设用地 | - | 0.353 | 坡耕地 | - | 0.470 |
Table 3 B values under different LUCC and FVC
| 土地利 用类型 (LUCC) | 植被盖度 (FVC,%) | B值 | 土地利 用类型 (LUCC) | 植被盖度 (FVC,%) | B值 |
|---|---|---|---|---|---|
| 林地 | 0~20 | 0.100 | 草地 | 0~20 | 0.450 |
| 20~40 | 0.080 | 20~40 | 0.240 | ||
| 40~60 | 0.060 | 40~60 | 0.150 | ||
| 60~80 | 0.020 | 60~80 | 0.090 | ||
| 80~100 | 0.004 | 80~100 | 0.043 | ||
| 水域 | - | 0 | 平耕地 | - | 0.230 |
| 建设用地 | - | 0.353 | 坡耕地 | - | 0.470 |

Fig.5 B factor distribution in the mountainous area of south Anhui from 1990 to 2020

Fig.6 E factor distribution in the mountainous area of south Anhui from 1990 to 2020
| 年份 | 最大值 | 最小值 | 平均值 |
|---|---|---|---|
| 1990 | 1 | 0.084 | 0.622 |
| 2000 | 1 | 0.084 | 0.656 |
| 2010 | 1 | 0.084 | 0.659 |
| 2020 | 1 | 0.084 | 0.670 |
Table 4 E factor characteristic statistics in the mountainous area of south Anhui
| 年份 | 最大值 | 最小值 | 平均值 |
|---|---|---|---|
| 1990 | 1 | 0.084 | 0.622 |
| 2000 | 1 | 0.084 | 0.656 |
| 2010 | 1 | 0.084 | 0.659 |
| 2020 | 1 | 0.084 | 0.670 |
| 参数 | 坡度 | ||||||
|---|---|---|---|---|---|---|---|
| >25° | 0° | ≤ 5° | 5°~ 10° | 10°~ 15° | 15°~ 20° | 20°~ 25° | |
| T | 1 | 0.1 | 0.221 | 0.305 | 0.575 | 0.705 | 1 |
Table 5 T value under different slope conditions
| 参数 | 坡度 | ||||||
|---|---|---|---|---|---|---|---|
| >25° | 0° | ≤ 5° | 5°~ 10° | 10°~ 15° | 15°~ 20° | 20°~ 25° | |
| T | 1 | 0.1 | 0.221 | 0.305 | 0.575 | 0.705 | 1 |

Fig.7 T factor distribution in the mountainous area of south Anhui

Fig.8 Soil erosion degree distribution in the mountainous area of south Anhui from 1990 to 2020
| 不同土壤侵蚀级别的面积(km2)及占比(%) | 平均模数 (t/(km2 ·a)) | 像元模数 最大值 (t/km2 ·a)) | 侵蚀量 (万t) | 强烈及以 上侵蚀量 (万t) | |||||
|---|---|---|---|---|---|---|---|---|---|
| 年份 | 轻微侵蚀 | 轻度侵蚀 | 中度侵蚀 | 强烈侵蚀 | 极强烈侵蚀 | ||||
| 1990 | 21796(50.91) | 11042(25.79) | 8128(18.99) | 1732(4.05) | 110(0.26) | 1336 | 13323 | 5719 | 1492 |
| 2000 | 21594(50.44) | 13215(30.87) | 7029(16.42) | 942(2.20) | 27(0.07) | 1143 | 12130 | 4893 | 761 |
| 2010 | 20468(47.81) | 10555(24.66) | 8409(19.64) | 2978(6.96) | 394(0.92) | 1558 | 16679 | 6669 | 2893 |
| 2020 | 19369(45.24) | 11891(27.78) | 8649(20.20) | 2631(6.15) | 268(0.63) | 1534 | 14966 | 6565 | 2439 |
Table 6 Statistics of soil erosion characteristics in the mountainous area of south Anhui from 1990 to 2020
| 不同土壤侵蚀级别的面积(km2)及占比(%) | 平均模数 (t/(km2 ·a)) | 像元模数 最大值 (t/km2 ·a)) | 侵蚀量 (万t) | 强烈及以 上侵蚀量 (万t) | |||||
|---|---|---|---|---|---|---|---|---|---|
| 年份 | 轻微侵蚀 | 轻度侵蚀 | 中度侵蚀 | 强烈侵蚀 | 极强烈侵蚀 | ||||
| 1990 | 21796(50.91) | 11042(25.79) | 8128(18.99) | 1732(4.05) | 110(0.26) | 1336 | 13323 | 5719 | 1492 |
| 2000 | 21594(50.44) | 13215(30.87) | 7029(16.42) | 942(2.20) | 27(0.07) | 1143 | 12130 | 4893 | 761 |
| 2010 | 20468(47.81) | 10555(24.66) | 8409(19.64) | 2978(6.96) | 394(0.92) | 1558 | 16679 | 6669 | 2893 |
| 2020 | 19369(45.24) | 11891(27.78) | 8649(20.20) | 2631(6.15) | 268(0.63) | 1534 | 14966 | 6565 | 2439 |

Fig.9 Changes in soil erosion in the mountainous area of south Anhui from 1990 to 2020
| 土壤侵蚀程度 | 2020年 | |||||
|---|---|---|---|---|---|---|
| 轻微 侵蚀 | 轻度 侵蚀 | 中度 侵蚀 | 强烈 侵蚀 | 极强烈 侵蚀 | ||
| 1990年 | 轻微侵蚀 | 18750.17 | 3030.81 | 74.66 | ||
| 轻度侵蚀 | 703.90 | 8505.84 | 1773.97 | 27.71 | 2.52 | |
| 中度侵蚀 | 266.22 | 6766.20 | 1070.95 | |||
| 强烈侵蚀 | 49.52 | 1525.37 | 150.85 | |||
| 极强烈侵蚀 | 111.88 | |||||
Table 7 Soil erosion transfer matrix in the mountainous area of south Anhui from 1990 to 2020 (km2)
| 土壤侵蚀程度 | 2020年 | |||||
|---|---|---|---|---|---|---|
| 轻微 侵蚀 | 轻度 侵蚀 | 中度 侵蚀 | 强烈 侵蚀 | 极强烈 侵蚀 | ||
| 1990年 | 轻微侵蚀 | 18750.17 | 3030.81 | 74.66 | ||
| 轻度侵蚀 | 703.90 | 8505.84 | 1773.97 | 27.71 | 2.52 | |
| 中度侵蚀 | 266.22 | 6766.20 | 1070.95 | |||
| 强烈侵蚀 | 49.52 | 1525.37 | 150.85 | |||
| 极强烈侵蚀 | 111.88 | |||||

Fig.10 Distribution map of forest erosion from 1990 to 2020

Fig.11 Distribution map of farmland erosion from 1990 to 2020
| 土地类型 | 年份 | 轻微侵蚀 | 轻度侵蚀 | 中度侵蚀 | 强烈侵蚀 | 极强烈侵蚀 | 剧烈侵蚀 |
|---|---|---|---|---|---|---|---|
| 林地 | 1990 | 4098.61 | 8934.89 | 7665.51 | 1685.38 | 109.17 | 0 |
| 2000 | 5953.92 | 10143.89 | 6132.92 | 859.04 | 25.40 | 0 | |
| 2010 | 5336.53 | 7440.07 | 7168.47 | 2669.90 | 362.00 | 3.82 | |
| 2020 | 4573.79 | 7880.18 | 7347.24 | 2351.72 | 248.64 | 0.00 | |
| 耕地 | 1990 | 16094.06 | 1736.98 | 421.55 | 43.00 | 1.25 | |
| 2000 | 13023.62 | 2709.55 | 866.32 | 79.78 | 11.29 | ||
| 2010 | 12475.30 | 2667.54 | 1105.56 | 291.65 | 30.43 | ||
| 2020 | 11707.10 | 3068.04 | 1161.04 | 253.34 | 20.27 |
Table 8 Area of soil erosion in forestland and cropland in the mountainous area of south Anhui from 1990 to 2020
| 土地类型 | 年份 | 轻微侵蚀 | 轻度侵蚀 | 中度侵蚀 | 强烈侵蚀 | 极强烈侵蚀 | 剧烈侵蚀 |
|---|---|---|---|---|---|---|---|
| 林地 | 1990 | 4098.61 | 8934.89 | 7665.51 | 1685.38 | 109.17 | 0 |
| 2000 | 5953.92 | 10143.89 | 6132.92 | 859.04 | 25.40 | 0 | |
| 2010 | 5336.53 | 7440.07 | 7168.47 | 2669.90 | 362.00 | 3.82 | |
| 2020 | 4573.79 | 7880.18 | 7347.24 | 2351.72 | 248.64 | 0.00 | |
| 耕地 | 1990 | 16094.06 | 1736.98 | 421.55 | 43.00 | 1.25 | |
| 2000 | 13023.62 | 2709.55 | 866.32 | 79.78 | 11.29 | ||
| 2010 | 12475.30 | 2667.54 | 1105.56 | 291.65 | 30.43 | ||
| 2020 | 11707.10 | 3068.04 | 1161.04 | 253.34 | 20.27 |
| 坡度 (°) | 年份 | 侵蚀 面积 (km2) | 百分比 (%) | 平均 模数 (t/km2 ·a)) | 侵蚀 总量 (万t) | 侵蚀 比例 (%) |
|---|---|---|---|---|---|---|
| < 5 | 1990 | 19636 | 35.84 | 569 | 45.23 | 1.70 |
| 2000 | 18865 | 34.88 | 494 | 42.35 | 1.98 | |
| 2010 | 18269 | 34.28 | 639 | 67.45 | 2.00 | |
| 2020 | 17735 | 33.86 | 650 | 68.34 | 2.18 | |
| 5~8 | 1990 | 6496 | 11.86 | 767 | 78.95 | 3.01 |
| 2000 | 6419 | 11.87 | 683 | 67.79 | 3.17 | |
| 2010 | 6323 | 11.86 | 893 | 105.93 | 3.15 | |
| 2020 | 6093 | 11.63 | 995 | 102.90 | 3.28 | |
| 8~15 | 1990 | 8935 | 16.30 | 1270 | 235.95 | 8.90 |
| 2000 | 8942 | 16.53 | 1092 | 188.51 | 8.81 | |
| 2010 | 8871 | 16.65 | 1466 | 308.54 | 9.18 | |
| 2020 | 8693 | 16.60 | 1577 | 716.83 | 9.10 | |
| 15~25 | 1990 | 10112 | 18.45 | 2263 | 604.60 | 23.05 |
| 2000 | 10181 | 18.82 | 1964 | 467.00 | 21.82 | |
| 2010 | 10158 | 19.06 | 2681 | 788.95 | 23.48 | |
| 2020 | 10143 | 19.36 | 2640 | 716.83 | 22.90 | |
| 25~35 | 1990 | 6845 | 12.49 | 3810 | 894.50 | 34.10 |
| 2000 | 6885 | 12.73 | 3219 | 724.25 | 33.84 | |
| 2010 | 6880 | 12.91 | 4368 | 1162.29 | 34.60 | |
| 2020 | 6897 | 13.16 | 4208 | 1062.63 | 28.60 | |
| 35 | 1990 | 2769 | 5.05 | 5588 | 763.37 | 29.10 |
| 2000 | 2795 | 5.17 | 3219 | 724.25 | 30.39 | |
| 2010 | 2792 | 5.23 | 6492 | 926.45 | 27.58 | |
| 2020 | 2812 | 5.36 | 6212 | 896.98 | 28.60 |
Table 9 Soil erosion at different slopes
| 坡度 (°) | 年份 | 侵蚀 面积 (km2) | 百分比 (%) | 平均 模数 (t/km2 ·a)) | 侵蚀 总量 (万t) | 侵蚀 比例 (%) |
|---|---|---|---|---|---|---|
| < 5 | 1990 | 19636 | 35.84 | 569 | 45.23 | 1.70 |
| 2000 | 18865 | 34.88 | 494 | 42.35 | 1.98 | |
| 2010 | 18269 | 34.28 | 639 | 67.45 | 2.00 | |
| 2020 | 17735 | 33.86 | 650 | 68.34 | 2.18 | |
| 5~8 | 1990 | 6496 | 11.86 | 767 | 78.95 | 3.01 |
| 2000 | 6419 | 11.87 | 683 | 67.79 | 3.17 | |
| 2010 | 6323 | 11.86 | 893 | 105.93 | 3.15 | |
| 2020 | 6093 | 11.63 | 995 | 102.90 | 3.28 | |
| 8~15 | 1990 | 8935 | 16.30 | 1270 | 235.95 | 8.90 |
| 2000 | 8942 | 16.53 | 1092 | 188.51 | 8.81 | |
| 2010 | 8871 | 16.65 | 1466 | 308.54 | 9.18 | |
| 2020 | 8693 | 16.60 | 1577 | 716.83 | 9.10 | |
| 15~25 | 1990 | 10112 | 18.45 | 2263 | 604.60 | 23.05 |
| 2000 | 10181 | 18.82 | 1964 | 467.00 | 21.82 | |
| 2010 | 10158 | 19.06 | 2681 | 788.95 | 23.48 | |
| 2020 | 10143 | 19.36 | 2640 | 716.83 | 22.90 | |
| 25~35 | 1990 | 6845 | 12.49 | 3810 | 894.50 | 34.10 |
| 2000 | 6885 | 12.73 | 3219 | 724.25 | 33.84 | |
| 2010 | 6880 | 12.91 | 4368 | 1162.29 | 34.60 | |
| 2020 | 6897 | 13.16 | 4208 | 1062.63 | 28.60 | |
| 35 | 1990 | 2769 | 5.05 | 5588 | 763.37 | 29.10 |
| 2000 | 2795 | 5.17 | 3219 | 724.25 | 30.39 | |
| 2010 | 2792 | 5.23 | 6492 | 926.45 | 27.58 | |
| 2020 | 2812 | 5.36 | 6212 | 896.98 | 28.60 |

Fig.12 Proportion of soil erosion on different slopes from 1990 to 2020
| DEM等级(m) | 年份 | 土壤侵蚀面积(km2) | 面积百分比(%) | 平均侵蚀模数(t/(km2·a)) | 侵蚀总量(万t) | 侵蚀比例 | DEM等级 | 土壤侵蚀面积(km2) | 面积百分比(%) | 平均侵蚀模数(t/(km2·a)) | 侵蚀总量(万t) | 侵蚀比例(%) |
|---|---|---|---|---|---|---|---|---|---|---|---|---|
| <100 | 1990 | 25721 | 46.05 | 1541 | 321 | 10.30 | 100~200 | 8845 | 16.47 | 2084 | 562 | 18.08 |
| 2000 | 24884 | 46.99 | 1382 | 297 | 11.46 | 8900 | 16.16 | 1844 | 464 | 17.90 | ||
| 2010 | 24249 | 45.15 | 1739 | 434 | 11.24 | 8793 | 16.33 | 2404 | 693 | 17.93 | ||
| 2020 | 23570 | 45.54 | 1752 | 452 | 12.14 | 8527 | 16.51 | 2410 | 669 | 17.99 | ||
| 200~500 | 1990 | 14765 | 27.40 | 2835 | 1230 | 39.54 | 500~800 | 4111 | 7.65 | 3399 | 689 | 22.15 |
| 2000 | 14804 | 26.98 | 2470 | 983 | 37.92 | 4133 | 7.51 | 2907 | 574 | 22.13 | ||
| 2010 | 14765 | 28.01 | 3287 | 1536 | 39.79 | 4122 | 7.94 | 3977 | 830 | 21.50 | ||
| 2020 | 14621 | 27.73 | 3206 | 1478 | 39.72 | 4144 | 7.74 | 3763 | 774 | 20.80 | ||
| 00~1500 | 1990 | 1269 | 2.41 | 4213 | 304 | 9.78 | >1500 | 18.59 | 0.03 | 3642 | 4 | 0.13 |
| 2000 | 1300 | 2.32 | 3649 | 269 | 10.36 | 18.59 | 0.03 | 3363 | 4 | 0.14 | ||
| 2010 | 1294 | 2.53 | 4981 | 363 | 9.40 | 18.59 | 0.04 | 4623 | 5 | 0.13 | ||
| 2020 | 1321 | 2.43 | 4621 | 343 | 9.23 | 18.59 | 0.03 | 4292 | 5 | 0.13 |
Table 10 Soil erosion at different altitudes
| DEM等级(m) | 年份 | 土壤侵蚀面积(km2) | 面积百分比(%) | 平均侵蚀模数(t/(km2·a)) | 侵蚀总量(万t) | 侵蚀比例 | DEM等级 | 土壤侵蚀面积(km2) | 面积百分比(%) | 平均侵蚀模数(t/(km2·a)) | 侵蚀总量(万t) | 侵蚀比例(%) |
|---|---|---|---|---|---|---|---|---|---|---|---|---|
| <100 | 1990 | 25721 | 46.05 | 1541 | 321 | 10.30 | 100~200 | 8845 | 16.47 | 2084 | 562 | 18.08 |
| 2000 | 24884 | 46.99 | 1382 | 297 | 11.46 | 8900 | 16.16 | 1844 | 464 | 17.90 | ||
| 2010 | 24249 | 45.15 | 1739 | 434 | 11.24 | 8793 | 16.33 | 2404 | 693 | 17.93 | ||
| 2020 | 23570 | 45.54 | 1752 | 452 | 12.14 | 8527 | 16.51 | 2410 | 669 | 17.99 | ||
| 200~500 | 1990 | 14765 | 27.40 | 2835 | 1230 | 39.54 | 500~800 | 4111 | 7.65 | 3399 | 689 | 22.15 |
| 2000 | 14804 | 26.98 | 2470 | 983 | 37.92 | 4133 | 7.51 | 2907 | 574 | 22.13 | ||
| 2010 | 14765 | 28.01 | 3287 | 1536 | 39.79 | 4122 | 7.94 | 3977 | 830 | 21.50 | ||
| 2020 | 14621 | 27.73 | 3206 | 1478 | 39.72 | 4144 | 7.74 | 3763 | 774 | 20.80 | ||
| 00~1500 | 1990 | 1269 | 2.41 | 4213 | 304 | 9.78 | >1500 | 18.59 | 0.03 | 3642 | 4 | 0.13 |
| 2000 | 1300 | 2.32 | 3649 | 269 | 10.36 | 18.59 | 0.03 | 3363 | 4 | 0.14 | ||
| 2010 | 1294 | 2.53 | 4981 | 363 | 9.40 | 18.59 | 0.04 | 4623 | 5 | 0.13 | ||
| 2020 | 1321 | 2.43 | 4621 | 343 | 9.23 | 18.59 | 0.03 | 4292 | 5 | 0.13 |
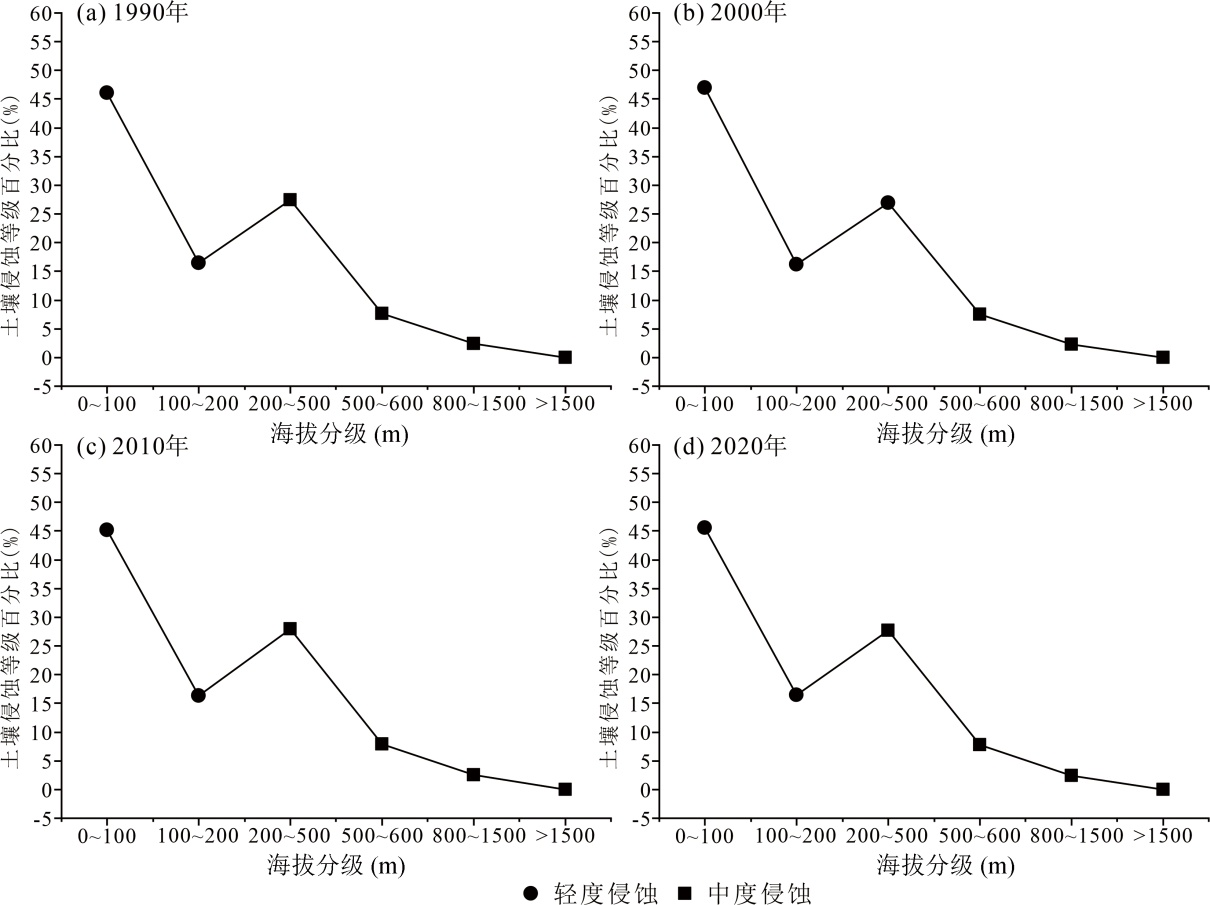
Fig.13 Proportion of soil erosion at different altitudes from 1990 to 2020
| [1] | 王礼先, 朱金兆. 水土保持学[M]. 2版. 北京: 中国林业出版社, 2005. |
| [2] | BORRELLI P, ROBINSON D A, FLEISCHER L R, et al. An assessment of the global impact of 21st century land use change on soil erosion[J]. Nature Communications, 2017, 8(1): 2013. |
| [3] | MARTÍN-FERNÁNDEZ L, MARTÍNEZ-NÚÑEZ M. An empirical approach to estimate soil erosion risk in Spain[J]. Science of the Total Environment, 2011, 409(17): 3114-3123. |
| [4] | MOAYEDI H, NAZIR R, FOONG L K, et al. A review on soil erosion control studies[M]// Advances in Remote Sensing and Geo Informatics Applications. Cham: Springer International Publishing, 2018: 211-213. |
| [5] | FLANAGAN D C, ASCOUGH J C, NIEBER J L, et al. Advances in soil erosion research: Processes, measurement, and modeling[J]. Transactions of the ASABE, 2013, 56(2): 455-463. |
| [6] | PIMENTEL D. Soil erosion: A food and environmental threat[J]. Environment, Development and Sustainability, 2006, 8(1): 119-137. |
| [7] | ZHAO W W, WEI H, JIA L Z, et al. Soil erodibility and its influencing factors on the Loess Plateau of China: A case study in the Ansai watershed[J]. Solid Earth, 2018, 9(6): 1507-1516. |
| [8] |
BORRELLI P, BALLABIO C, YANG J E, et al. GloSEM: High-resolution global estimates of present and future soil displacement in croplands by water erosion[J]. Scientific Data, 2022, 9(1): 406.
DOI PMID |
| [9] | WISCHMEIER W H, SMITH D. Predicting rainfall erosion losses: A guide to conservation planning[M]. United States Department of Agriculture.Agriculture Handbook (USA), 1978. |
| [10] | LIU B Y, ZHANG K L, XIE Y. An empirical soil loss equation[C]. Proceedings 12th International Soil Conservation Organization Conference. Beijing, 2002. |
| [11] | HATEFFARD F, MOHAMMED S, ALSAFADI K, et al. CMIP5 climate projections and RUSLE-based soil erosion assessment in the central part of Iran[J]. Scientific Reports, 2021, 11(1):72-73. |
| [12] | 陈浩, 张晓萍, 王豆豆, 等. 北洛河上游流域土壤侵蚀变化及影响因素分析[J]. 中国水土保持科学(中英文), 2023, 21(2): 64-73. |
| [13] | 管礼松. 基于CSLE模型的皖南山区土壤侵蚀评价及预测研究[D]. 淮南: 安徽理工大学, 2021. |
| [14] | FU B J, LIU Y, LÜ Y H, et al. Assessing the soil erosion control service of ecosystems change in the Loess Plateau of China[J]. Ecological Complexity, 2011, 8(4): 284-293. |
| [15] | FU B J, WANG S, LIU Y, et al. Hydrogeomorphic ecosystem responses to natural and anthropogenic changes in theLoess Plateau of China[J]. Annual Review of Earth and Planetary Sciences, 2017, 45: 223-243. |
| [16] |
GAO H D, LI Z B, JIA L L, et al. Capacity of soil loss control in the Loess Plateau based on soil erosion control degree[J]. Journal of Geographical Sciences, 2016, 26(4): 457-472.
DOI |
| [17] | LIU J N, QI X Q, MA C Y, et al. Response of sheet erosion to the characteristics of physical soil crusts for loessial soils[J]. Frontiers in Environmental Science, 2022, 10: 905045. |
| [18] | LIU G, LIU P L, ZHANG Q, et al. Assessment of soil erosion risk based on loess deposition rate[C]. Asia-Pacific Power and Energy Engineering Conference. 2011,25-28. |
| [19] | ZHAO G, MU X, WEN Z, et al. Soil erosion, conservation, and eco-environment changes in the Loess Plateau of China[J]. Land Degradation & Development, 2013, 24(5): 499-510. |
| [20] | LI P F, MU X M, HOLDEN J, et al. Comparison of soil erosion models used to study the Chinese Loess Plateau[J]. Earth-Science Reviews, 2017, 170: 17-30. |
| [21] | 陈思旭, 杨小唤, 肖林林, 等. 基于RUSLE模型的南方丘陵山区土壤侵蚀研究[J]. 资源科学, 2014, 36(6): 1288-1297. |
| [22] | 陈龙, 谢高地, 张昌顺, 等. 澜沧江流域土壤侵蚀的空间分布特征[J]. 资源科学, 2012, 34(7): 1240-1247. |
| [23] | 陈燕红, 潘文斌, 蔡芫镔. 基于RUSLE的流域土壤侵蚀敏感性评价: 以福建省吉溪流域为例[J]. 山地学报, 2007, 25(4): 490-496. |
| [24] | LIU B Y, XIE Y, LI Z G, et al. The assessment of soil loss by water erosion in China[J]. International Soil and Water Conservation Research, 2020, 8(4): 430-439. |
| [25] | 刘宝元, 郭索彦, 李智广, 等. 中国水力侵蚀抽样调查[J]. 中国水土保持, 2013(10): 26-34. |
| [26] | 周伏建, 陈明华, 林福兴. 福建省降雨侵蚀力指标R值[J]. 中国水土保持, 1995, 9(3): 13-18. |
| [27] | 刘宝元, 张科利, 焦菊英. 土壤可蚀性及其在侵蚀预报中的应用[J]. 自然资源学报, 1999, 14(4): 345-350. |
| [28] | HUANG X F, LIN L R, DING S W, et al. Characteristics of soil erodibility K value and its influencing factors in theChangyan watershed, southwest Hubei, China[J]. Land, 2022, 11(1): 134. |
| [29] | 张科利, 彭文英, 杨红丽. 中国土壤可蚀性值及其估算[J]. 土壤学报, 2007, 44(1): 7-13. |
| [30] | 环境保护部, 国家发展改革委. .生态保护红线划定指南[R]. 环境保护部, 国家发展改革委, 2017. |
| [31] | 高峰. 基于GIS和CSLE的区域土壤侵蚀定量评价研究[D]. 南宁: 广西师范学院, 2014. |
| [32] | 蔡崇法, 丁树文, 史志华, 等. 应用USLE模型与地理信息系统IDRISI预测小流域土壤侵蚀量的研究[J]. 水土保持学报, 2000(2): 19-24. |
| [33] | 张岩, 刘宝元, 史培军, 等. 黄土高原土壤侵蚀作物覆盖因子计算[J]. 生态学报, 2001, 21(7) : 1050-1056. |
| [34] | 程琳, 杨勤科, 谢红霞, 等. 基于GIS和CSLE的陕西省土壤侵蚀定量评价方法研究[J]. 水土保持学报, 2009, 23(5): 61-66. |
| [35] | 谢红霞. 延河流域土壤侵蚀时空变化及水土保持环境效应评价研究[D]. 西安: 陕西师范大学, 2008. |
| [36] | 曹文洪. 土壤侵蚀的坡度界限研究[J]. 水土保持通报, 1993, 13(4): 1-5. |
| [37] |
靳长兴. 论坡面侵蚀的临界坡度[J]. 地理学报, 1995, 50(3): 234-239.
DOI |
| [38] | 孙泽祥. 基于GIS和RS的沂河上游重点地区土壤侵蚀监测方法研究[D]. 济南: 山东师范大学, 2012. |
| [39] | 韩帅, 孙萍, 李荣建, 等. 甘肃天水地区强降雨诱发黄土-泥岩滑坡机理实验研究[J]. 现代地质, 2021, 35(3): 720-731. |
| [40] | 张卢明, 杨东, 周勇, 等. 震后深切拉槽型泥石流成因模式、暴发特点与防治: 以四川九寨沟牙扎沟为例[J]. 现代地质, 2021, 35(3): 744-752. |
| [41] | 管礼松, 郭伟玲, 李鑫, 等. 2000—2018年皖南山区土壤侵蚀时空变化[J]. 水土保持通报, 2021, 41(2): 114-121. |
| [42] | 魏总, 杨朝磊, 田瑜峰, 等. 金沙江干热河谷区土壤侵蚀时空演变及其定量归因分析: 以云南楚雄元谋地区为例[J]. 现代地质, 2024, 38(3): 683-693. |
| [1] | LI Zhiheng, LIU Xiaohuang, XIA Xueqi, XIAO Yuexin, ZHANG Wenbo, WANG Ran, LUO Xinping, XING Liyuan. Spatiotemporal Dynamics and Multiscale Drivers of Agricultural Soil Erosion in the North China Plain from 1990 to 2020 [J]. Geoscience, 2025, 39(02): 467-476. |
| [2] | WEI Zong, YANG Chaolei, TIAN Yufeng, YANG Jinjiang, HUANG Yong, HE Feng, ZHU Zhiping. Spatial-temporal Variations of Soil Erosion and Quantitative Attribution Analysis in the Dry-hot Valleys of the Jinsha River: A Case Study of Yuanmou County, Yunnan [J]. Geoscience, 2024, 38(03): 683-693. |
| [3] | MIN Jie, LIU Xiaohuang, XIAO Yuexin, LI Hongyu, LUO Xinping, WANG Ran, XING Liyuan, WANG Chao, ZHAO Honghui. Analysis and Predictions of the Spatiotemporal Variations of Ecosystem Carbon Storages in the Xin’an River Basin Based on PLUS and InVEST Models [J]. Geoscience, 2024, 38(03): 574-588. |
| [4] | LIU Guodong, DAI Huimin, YANG Ze, XU Jiang, ZHANG Yihe, WEI Minghui. Temporal and Spatial Changes of Soil Carbon Pool and Its Influencing Factors in the Sanjiang Plain [J]. Geoscience, 2021, 35(02): 443-454. |
| [5] | CHEN Zhen, ZHANG Yunshi, CHEN Jianping, AN Zhihong. Remote Sensing Classification for High Standard Farmland Based on Fractal Characteristics [J]. Geoscience, 2018, 32(03): 595-601. |
| [6] | JIANG Wei,HOU Qing-ye,YANG Zhong-Fang,JIA Hua-Qi,ZHONG Cong. Migration and Deposition Flux of Organic Carbon in the Wuyuerhe River Basin in Heilongjiang Province [J]. Geoscience, 2011, 25(2): 377-383. |
| Viewed | ||||||
|
Full text |
|
|||||
|
Abstract |
|
|||||